
acespicoli
Well-known member
AgroMax 600w Hybrid HPS/MH Lamp | HTG Supply Hydroponics & Grow Lights
The AgroMax 600w Hybrid HPS/MH Lamp is rated at 68,000 lumens for optimum plant growth. The lamp combines the effective and efficient power of an HPS with the blue spectrum light of an MH to bring you a balanced lighting system perfect for vegging! High-Pressure Sodium (HPS) light gives off a...
 www.htgsupply.com
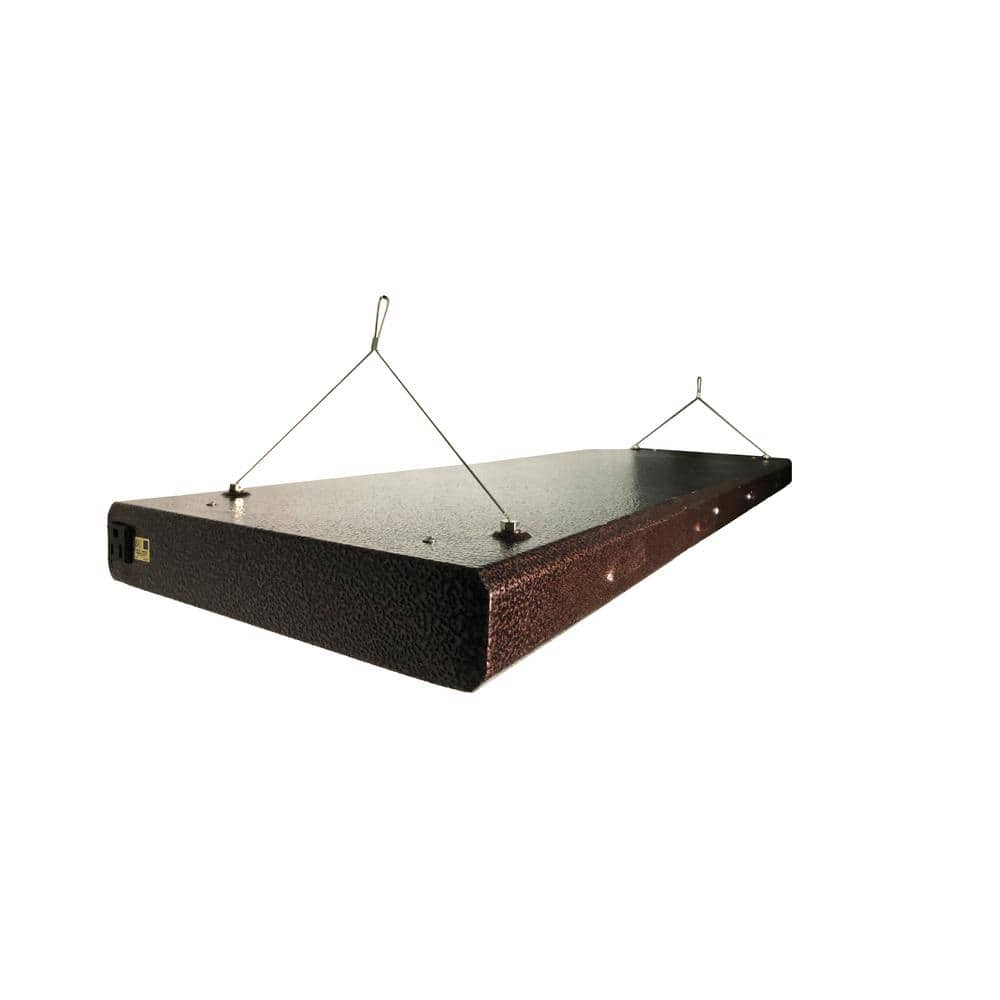
Hi-F 600w Digital Ballast by AgroMax | HTG Supply
Get the best growing technology for less at HTG Supply, like the all-new high frequency 600 watt digital ballast! Buy the ballast itself for an amazingly low price or save even more with a grow light package deal!
www.htgsupply.com
Overview
AgroMax Hi-F 600w Digital Ballast
The AgroMax High-Frequency 600-watt Digital Ballast, or Hi-F for short, is designed to run lamps at a much higher frequency than standard digital ballasts. The higher the frequency, the more efficient a lamp will run, and unlike most digital ballasts that only run lamps between 20-30kHz, the all-new AgroMax Hi-F ballast is capable of running lamps at up to 120kHz! Hi-F ballasts also feature a built-in monitoring system with an LED indicator light that can alert the user of any issues, as well as dimming controls so power can be adjusted to 60%, 75%, and 100% as needed. Compact and lightweight, Hi-F ballasts can be mounted just about anywhere and reduce clutter. Hi-F digital ballasts maintain the strict quality standards that AgroMax is known for with intuitive features that provide superior performance and long life. AgroMax-imize your 600-watt grow light with the Hi-F ballast for improved efficiency and bigger yields!Features:
• Dimmable (100%, 75%, 60%)
• Universal socket receptacle, accepts Hydrofarm & standard socket plugs
• Digital monitoring system with LED indicator
• Soft start protection
• End of lamp life protection
• Short-circuit & open protection
• Ignition failure protection
• UL listed for safety
Specs:
120v @ 5A or 240v @ 2.5A
Operating Frequency = 100kHz-120kHz
THD <10%
Striking distance = 50′
Length = 10.63″
Width = 5.28″
Height = 3.47″
Weight = 3.31lb
WHY NOT HAVE BOTH ?
PURE BLOOM – PURE PAR – PURE UV
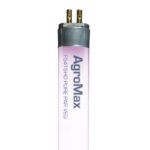
AgroMax Pure PAR Veg T5 Bulb
Pure PAR Veg T5 High Output Fluorescent Grow Lamps by AgroMax are the most advanced T5HO lamps on the market today for plant growth! With a highly specialized lighting spectrum output, AgroMax has engineered a lamp that pinpoints the exact wavelengths associated with plant growth by using a highly specialized phosphorescent coating. The AgroMax PurePAR …
AgroMax Pure UV T5 Bulb
UV light occurs naturally in Sunlight all over the earth. However, UV light is nearly entirely missing from indoor gardens. Nearly every commercially available HPS and MH lamp is constructed with UV blocking glass, therefore – little to no UV radiation will be provided – and LED technology has not been able to produce UV-B …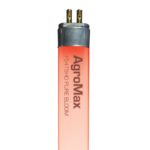
Pure Bloom T5 High Output Grow Lamp
Pure BLOOM T5 High Output Fluorescent Grow Lamps by AgroMax provides Pure flowering light energy. AgroMax has engineered a lamp that provides nourishing Red Light wavelengths associated with the flowering / blooming state of plant growth by using a highly specialized phosphorescent coating. Pure BLOOM T5 lamps concentrate over 90% of their lighting energy in …AgroMax 4′ Pure Bloom Technical Information:
- Fits all 4 ft. High Output T5 Fixtures
- F54T5HO Lamp Type
- 1-year Warranty
- Actual Bulb Length is 45-3/4″. Bulbs will not fit T8 or T12 Fluorescent Fixtures
- 54 watts
- LAMP TYPE: Pure PAR Flowering
IM WAITING ON ENGINEERING SPECS FROM THE MANUFACTURER T5 AND HYBRID HPS/MH
***
ViaVolt 4 ft. 4-Bulb T5 High Output Copper Fluorescent Grow Light Fixture V44 - The Home Depot
Propagate your seedlings effectively with a high output fluorescent light made for plant propagation. 20,000 total lumens in the blue spectrum is perfect for propagating seedlings, clones, or keeping plants happy year round. At 5,000 lumens and 54-Watt per bulb, the high output T-5 boasts itself...
www.homedepot.com
About This Product
Propagate your seedlings effectively with a high output fluorescent light made for plant propagation. 20,000 total lumens in the blue spectrum is perfect for propagating seedlings, clones, or keeping plants happy year round. At 5,000 lumens and 54-Watt per bulb, the high output T-5 boasts itself as the strongest fluorescent lighting around.Highlights
- Steel housing
- Louvered and slotted for efficient cooling
- Highly reflective aluminum reflector
- Major brand solid st
- electronic ballasts
- 1 year rebuild or replacement warranty
- Comes complete with 2 chrome hangers and 7 ft. power cord
- Blue spectrum 6400K bulbs included
- 120-Volt only
- Perfect for propagation
- Click here for more information on Electronic Recycling Programs
- Return Policy
Product Information
Internet # 203012866
Model # V44
Additional Resources
Shop All ViaVoltFrom the Manufacturer
FINDING T5 HO HIGHBAY COMMERCIAL DAMP AREA FIXTURES HAVE BEEN CHALLENGINGT8 SEEM MUCH MORE READILY... AVAILABLE
Last edited:
 How many years hours have they logged running 16/8 on/off veg and 11/13 on/off flower


") , but its uv paper i meant. They also have some similar terms but another article.
, but its uv paper i meant. They also have some similar terms but another article.
