What's new
  • ICMag with help from Landrace Warden and The Vault is running a NEW contest in November! You can check it here. Prizes are seeds & forum premium access. Come join in!

Let there be light - What's the best grow lights, growing ?

Whats Your Favorite Light Source, besides the sun... ;)

  • HPS - HIGH PRESSURE SODIUM

    Votes: 24 31.2%
  • DE HPS - DOUBLE ENDED HIGH PRESSURE SODIUM

    Votes: 5 6.5%
  • MH - METAL HALIDE

    Votes: 8 10.4%
  • HID - HIGH INTENSITY DISCHAGE

    Votes: 2 2.6%
  • CMH - CERAMIC METAL HALIDES

    Votes: 14 18.2%
  • LED - LIGHT EMITTING DIODE

    Votes: 37 48.1%
  • FLOURESCENT -

    Votes: 6 7.8%
  • MISSED ONE, MADE A MISTAKE - ADD IT IN COMMENTS PLEASE

    Votes: 1 1.3%
  • DIY LED

    Votes: 6 7.8%
  • THE SUN

    Votes: 15 19.5%
  • HYBRID BULB HPS/MH

    Votes: 0 0.0%

  • Total voters
    77

acespicoli

Well-known member
1723065086743.png

1723065102830.png

1723065119673.png

screenshot-www.htgsupply.com-2024.08.07-17_43_57.png

screen-shot-2018-10-07-at-10-50-29-am_orig.png

Overview​

AgroMax Hi-F 600w Digital Ballast​

The AgroMax High-Frequency 600-watt Digital Ballast, or Hi-F for short, is designed to run lamps at a much higher frequency than standard digital ballasts. The higher the frequency, the more efficient a lamp will run, and unlike most digital ballasts that only run lamps between 20-30kHz, the all-new AgroMax Hi-F ballast is capable of running lamps at up to 120kHz! Hi-F ballasts also feature a built-in monitoring system with an LED indicator light that can alert the user of any issues, as well as dimming controls so power can be adjusted to 60%, 75%, and 100% as needed. Compact and lightweight, Hi-F ballasts can be mounted just about anywhere and reduce clutter. Hi-F digital ballasts maintain the strict quality standards that AgroMax is known for with intuitive features that provide superior performance and long life. AgroMax-imize your 600-watt grow light with the Hi-F ballast for improved efficiency and bigger yields!
Features:
Dimmable (100%, 75%, 60%)
Universal socket receptacle, accepts Hydrofarm & standard socket plugs
Digital monitoring system with LED indicator
Soft start protection
End of lamp life protection
Short-circuit & open protection
Ignition failure protection
UL listed for safety
Specs:
120v @ 5A or 240v @ 2.5A
Operating Frequency = 100kHz-120kHz
THD <10%
Striking distance = 50′
Length = 10.63″
Width = 5.28″
Height = 3.47″
Weight = 3.31lb
WHY NOT HAVE BOTH ?
screenshot-pqlighting.com-2024.08.07-17_20_44.png

PURE BLOOM – PURE PAR – PURE UV​


AgroMax Pure PAR Veg T5 Bulb

Pure PAR Veg T5 High Output Fluorescent Grow Lamps by AgroMax are the most advanced T5HO lamps on the market today for plant growth! With a highly specialized lighting spectrum output, AgroMax has engineered a lamp that pinpoints the exact wavelengths associated with plant growth by using a highly specialized phosphorescent coating. The AgroMax PurePAR …

AgroMax Pure UV T5 Bulb

UV light occurs naturally in Sunlight all over the earth. However, UV light is nearly entirely missing from indoor gardens. Nearly every commercially available HPS and MH lamp is constructed with UV blocking glass, therefore – little to no UV radiation will be provided – and LED technology has not been able to produce UV-B …
Pure Bloom T5 High Output Grow Lamp

Pure BLOOM T5 High Output Fluorescent Grow Lamps by AgroMax provides Pure flowering light energy. AgroMax has engineered a lamp that provides nourishing Red Light wavelengths associated with the flowering / blooming state of plant growth by using a highly specialized phosphorescent coating. Pure BLOOM T5 lamps concentrate over 90% of their lighting energy in …

AgroMax 4′ Pure Bloom Technical Information:

  • Fits all 4 ft. High Output T5 Fixtures
  • F54T5HO Lamp Type
  • 1-year Warranty
  • Actual Bulb Length is 45-3/4″. Bulbs will not fit T8 or T12 Fluorescent Fixtures
  • 54 watts
  • LAMP TYPE: Pure PAR Flowering

IM WAITING ON ENGINEERING SPECS FROM THE MANUFACTURER T5 AND HYBRID HPS/MH


***
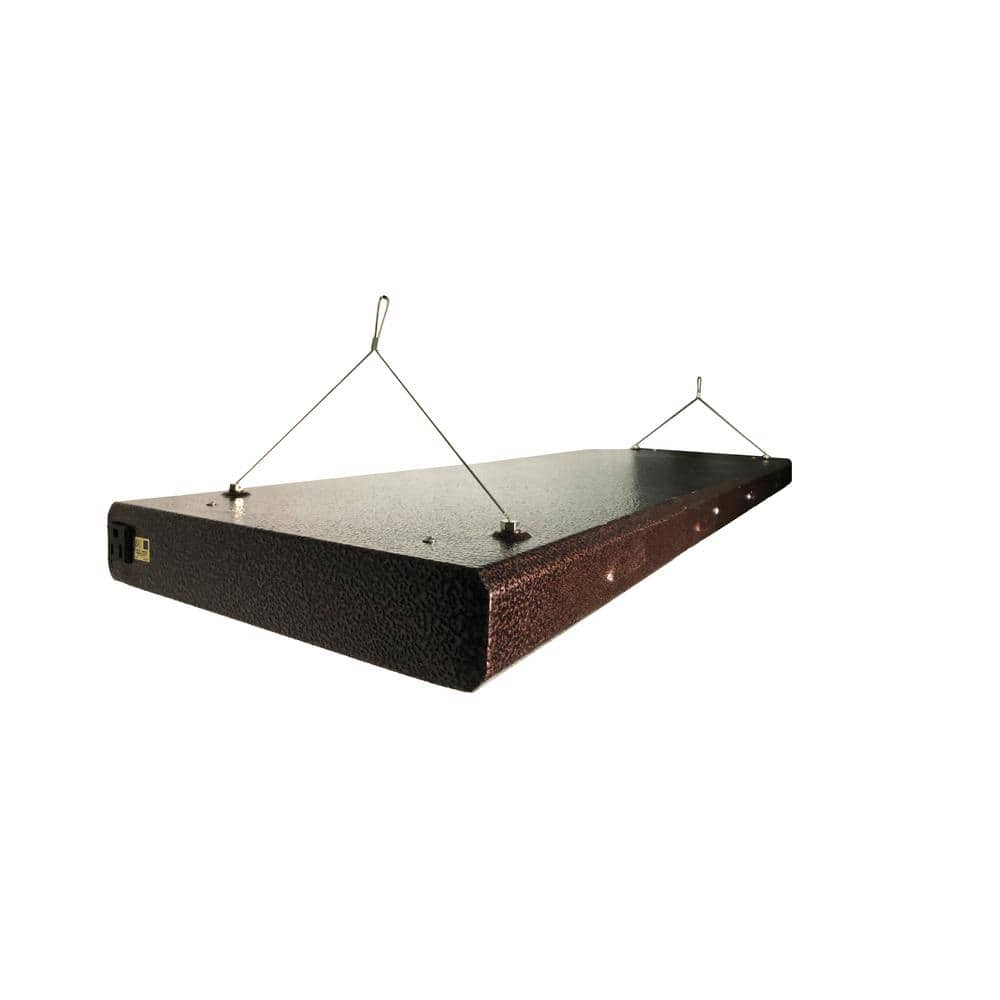
screenshot-www.homedepot.com-2024.08.07-17_36_54.png

About This Product​

Propagate your seedlings effectively with a high output fluorescent light made for plant propagation. 20,000 total lumens in the blue spectrum is perfect for propagating seedlings, clones, or keeping plants happy year round. At 5,000 lumens and 54-Watt per bulb, the high output T-5 boasts itself as the strongest fluorescent lighting around.

Highlights​

  • Steel housing
  • Louvered and slotted for efficient cooling
  • Highly reflective aluminum reflector
  • Major brand solid st
  • electronic ballasts
  • 1 year rebuild or replacement warranty
  • Comes complete with 2 chrome hangers and 7 ft. power cord
  • Blue spectrum 6400K bulbs included
  • 120-Volt only
  • Perfect for propagation
  • Click here for more information on Electronic Recycling Programs
  • Return Policy

Product Information​

Internet # 203012866​

Model # V44​

Additional Resources​

Shop All ViaVolt

From the Manufacturer​

FINDING T5 HO HIGHBAY COMMERCIAL DAMP AREA FIXTURES HAVE BEEN CHALLENGING
T8 SEEM MUCH MORE READILY... AVAILABLE
 
Last edited:

amanda88

Well-known member
but thats just my age reminding me how lucky we are, right ?
The LED lights are nice just had some issues with the quality and longevity of the units
Makes me wonder how many years people have on their LED
for the price they have to produce returns on the investment without dimming for an extended period
:thinking: How many years hours have they logged running 16/8 on/off veg and 11/13 on/off flower
What kinda mileage you have on them so far?

For many years I used flouro, M/h and HPS, and knew that we as growers will have to move with the times even to save cash on the elec. bill, I searched high and low and settled on Migro lights as I was following him trying to decide, anyways he was the growlight critic when it came to LEDs on YouTube


Recently he has suggested that LED growers turn their lights down, to suit their DLI, overtime,
I have had a lot of anxiety over this as an Ex- hps user thats just dumb,
my photos get 18/6 as do my autos, its taken me a lot of patience, but the plants seem to like it, they are still dark green,
photos on 12x12 get the full 1000par until harvest, light level x over time =DLI...it seems to work


ARAY_4_PAR_map_B_d7f0d3ce-5d58-48e5-947f-196a884f3320_600x600.png

my par map maybe the best way for now to compare led grow lights? vegging at 10 inches and flowering at 6,
 
Last edited:

acespicoli

Well-known member
Theres a scientific paper and if I didnt already need to go back and look, it needs to be here.
The premise was that the more lumens the higer the yield and the white paper shows the science of exponetial increase in yield in relation to lumen increases.

Now at how close your lights are, it makes me think. Build a big fire sit further away, build a small fire and sit very close.

Then there is the idea that the light intensity and leaf thickness im reading that light is only penetrating thru 3 layers of leaves in the canopy so those lower leaves that die off... wasted effort in vegging for a month if it all ends up lolly popped anyway?

But some of this and SOG sea of green are things we have known since the 80s?

Its really a interesting hobby and just love growing a garden and tinkering with plants.

Flowers may be a bit airy and not as dense
For PM and molds airy is better so whos to say what the perfect setup is? May be if your happy with what you got, its perfect?

Food for thought :huggg:
 

Rocket Soul

Well-known member
Theres a scientific paper and if I didnt already need to go back and look, it needs to be here.
The premise was that the more lumens the higer the yield and the white paper shows the science of exponetial increase in yield in relation to lumen increases.

Now at how close your lights are, it makes me think. Build a big fire sit further away, build a small fire and sit very close.

Then there is the idea that the light intensity and leaf thickness im reading that light is only penetrating thru 3 layers of leaves in the canopy so those lower leaves that die off... wasted effort in vegging for a month if it all ends up lolly popped anyway?

But some of this and SOG sea of green are things we have known since the 80s?

Its really a interesting hobby and just love growing a garden and tinkering with plants.

Flowers may be a bit airy and not as dense
For PM and molds airy is better so whos to say what the perfect setup is? May be if your happy with what you got, its perfect?

Food for thought :huggg:
I think youre talking about a bugbee paper where they tried out normal to very high light intensity: it was not exponential increase in yield it was linear. But still they weren't able to get to a point were more light didnt create more bud iirc.

Lightlevels: already one layer down you have very little light. I think its a mistake to believe that a bud is built by the light that hits it, it can use photosynthesis from the top layer. If tops are at 50ppfd you get almost no bud. But if tops are 1000 and bottom buds are 50 you can still get good lower buds, as long as the plant has enough in total. Ive seen it in our grow, nice big buds on what would look like sucker branches in the lowers, +3g buds. Its about removing the right amount of lower budsites: concentrate growth to the right area.
 

acespicoli

Well-known member
I think youre talking about a bugbee paper where they tried out normal to very high light intensity: it was not exponential increase in yield it was linear. But still they weren't able to get to a point were more light didnt create more bud iirc.

Lightlevels: already one layer down you have very little light. I think its a mistake to believe that a bud is built by the light that hits it, it can use photosynthesis from the top layer. If tops are at 50ppfd you get almost no bud. But if tops are 1000 and bottom buds are 50 you can still get good lower buds, as long as the plant has enough in total. Ive seen it in our grow, nice big buds on what would look like sucker branches in the lowers, +3g buds. Its about removing the right amount of lower budsites: concentrate growth to the right area.

Front. Plant Sci., 26 September 2022
Sec. Crop and Product Physiology
Volume 13 - 2022 | https://doi.org/10.3389/fpls.2022.974018

Indoor grown cannabis yield increased proportionally with light intensity,​

"Cannabis proliferates at very high canopy LIs in indoor production environments. The increasing inflorescence (and associated cannabinoid) yield responses to high LI in this trial clearly shows the benefits to maximizing canopy-level PPFD within the economical constraints imposed by other production logistics (including input costs). " -

Potential costs and benefits of increasing light levels in commercial production​

The slope of the yield response curve relates to a crop’s phenotypic plasticity to respond to changes in environmental inputs – light intensity in this case – which will of course vary by genotype and production environment (Backer et al., 2019; Zheng and Llewellyn, 2022). Nevertheless, using the present study’s genotype as a proxy, one can estimate the payoff associated with increases in LI.


For example, increasing the PPFD by 100 μmol m–2 s–1 increases the total light integral over 45 days by 195 mol m–2. The estimated increase in yield of 51 g m–2 for 195 mol m–2 of additional lighting corresponds to a light use efficiency of 0.26 g mol–1.

The energy cost for additional lighting relies heavily on fixture efficacy, light distribution, and local cost of electricity. Most modern horticultural LED fixtures have efficacy values exceeding 2.5 μmol J–1 (i.e., 9 mol kWh–1) (Design Lights Consortium, 2022). If electricity cost was 0.10 $CAD/kWh, the estimated energy cost in this scenario would be approximately 0.042 $CAD/g or an energy use efficiency of approximately 2.4 g kWh–1 (for lighting). The increases in fixture efficacy in modern horticultural LEDs (Kusuma et al., 2020) may explain two-times higher estimated energy use efficiency in the present study vs. estimates from scientific studies in past decades (EMCDDA, 2012). At the current wholesale price for dried inflorescence of 4.00 $CAD/g (Cannabis Benchmarks, 2022), the added electricity cost of increasing yield by increasing LI comprises only ≈1% of the total price, and therefore may make economic sense. However, the costs of additional lighting infrastructure and ancillary costs such as heat management and higher crop production inputs must also be considered when assessing the potential profitability associated with any lighting strategy.

1723556949197.png
Table 3. Cannabinoid and total terpene content (mg g–1) of dry composite inflorescence samples of Cannabis sativa ‘Meridian’ plants grown under light emitting diodes (LEDs) for 45 days with average canopy-level photosynthetic photon densities (PPFD) of either 600, 800, or 1,000 μmol m–2 s–1 for 12 h day–1 or PPFD of 600 μmol m–2 s–1 plus ultraviolet (UV, 280–400 nm) from either UVA (12 h day–1 of 50 μmol m–2 s–1 from LEDs with peak wavelength of 385 nm for 45 days) or UVA + UVB [5 h day–1 of 3 μmol m–2 s–1 of wideband UV fluorescent lighting for the last 20 days of the flowering cycle (UVA+UVB)].

UV AFFECTING YIELD POTENCY TERPENES AND RESINS THIS IS IN A DIFFERENT PAPER
DO NOT DISREGARD UV LIGHT... THE OTHER PAPER FINDS ITS STRAIN DEPENDENT
SOME STRAINS RESPOND OTHER DONT 🤷‍♂️


acespicoli

Well-known member
1723566068149.png

Power Consumption Kilowatt Monitor​

From Walmart, Harbor Freight, Amazon right around 15$ USD
1723570081167.png

Interesting question is Hz Hertz where should it be plugged? Pre or Post ballast?
Draw or Output depends on what we want to measure 🤷‍♂️ right ?
Some tools were using here are meters for monitoring electricity usage and measuring PPFD
1723570447189.png

1723570646961.png

State officials have begun reigning in the pernicious practice of
“THC score inflation” in 2024 all across the state.
 
Last edited:

acespicoli

Well-known member

Longer Photoperiod Substantially Increases Indoor-Grown Cannabis’ Yield and Quality:

A Study of Two High-THC Cultivars Grown under 12 h vs. 13 h Days

Plants 2024, 13(3), 433; https://doi.org/10.3390/plants13030433

Figure 1. Elapsed days to flowering (EDTF) responses to 12 h (filled bars) and 13 h (empty bars) photoperiod treatments of C. sativa cultivars ‘Incredible Milk’ (IM) and ‘Gorilla Glue’ (GG). Data are means ± SE, n = 3. Error bars are presented for all data but may be obscured for small SE values. Percentage values marked in the 13 h bars signify the increase in EDTF relative to the 12 h treatment, and the p-values above each cultivar represent the significance level of the comparison of means according to Student’s t-test.
Plants 13 00433 g002

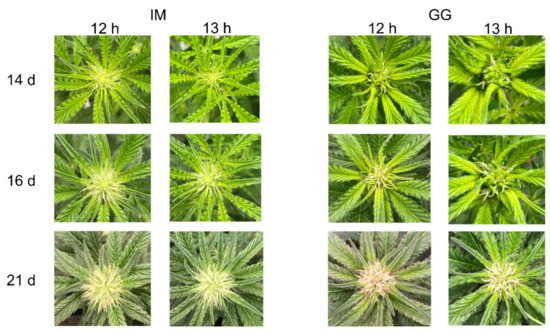
Figure 2. Representative photos showing early apical inflorescence development of C. sativa cultivars ‘Incredible Milk’ (IM) and ‘Gorilla Glue’ (GG) under 12 h and 13 h photoperiod treatments from 14 d to 21 d after the start of photoperiod treatments.
Plants 13 00433 g003

Figure 3. Temporal dynamics of stigma browning on the apical inflorescence of the primary shoot of C. sativa cultivars ‘Incredible Milk’ (IM, black) and ‘Gorilla Glue’ (GG, red) grown under 12 h (triangles) and 13 h (circles) photoperiod treatments. Data are means ± SE of three replicates (n = 3). Error bars are presented for all data but may be obscured for small SE values.

3.2. Inflorescence Yield​

There were no photoperiod treatment effects on apical inflorescence DW in GG, but the apical inflorescence DW in IM more than doubled under the 13 h vs. 12 h treatments (Figure 4 and Figure 5).
Plants 13 00433 g004

Figure 4. Dry weight responses of individual plants’ apical inflorescence to 12 h (filled bars) and 13 h (empty bars) photoperiod treatments of C. sativa cultivars ‘Incredible Milk’ (IM) and ‘Gorilla Glue’ (GG). Data are means ± SE, n = 3. Error bars are presented for all data but may be obscured for small SE values. Percentage values marked in the 13 h bars signify the increase in apical inflorescence dry weight relative to the 12 h treatment, and the p-values above each cultivar represent the significance level of the comparison of means according to Student’s t-test.
Plants 13 00433 g005

Figure 5. Images of the apical inflorescence of the primary shoot of representative plants at harvest of C. sativa ‘Incredible Milk’ (IM) plants on day 58 and of ‘Gorilla Glue’ (GG) on day 72 after the start of the photoperiod treatments. The white scale bars in each image are 5 cm.
There were no photoperiod treatment effects on apical inflorescence density in GG, but the apical inflorescence density of IM was 36% lower in the 13 h treatment (Figure 6).

Conclusions

The 13 h photo period treatment increased inflorescence yield disproportionately higher than the increase in DLI in both cultivars. In addition, while the longer photo period somewhat delayed inflorescence development, the major cannabinoid concentrations in the apical inflorescence tissues at commercial maturity were either unchanged or enhanced. Therefore, increasing the photo period during the flowering stage of indoor cannabis cultivation is an easily employed cultivation protocol for enhancing indoor cannabis production. However, cannabis’ photo period responses are strongly cultivar-dependent; growers must investigate the effects of photo periods with their own specific cultivars and cultivation systems.
Figure 1. Elapsed days to flowering (EDTF) responses to 12 h (filled bars) and 13 h (empty bars) photoperiod treatments of C. sativa cultivars ‘Incredible Milk’ (IM) and ‘Gorilla Glue’ (GG). Data are means ± SE, n = 3. Error bars are presented for all data but may be obscured for small SE values. Percentage values marked in the 13 h bars signify the increase in EDTF relative to the 12 h treatment, and the p-values above each cultivar represent the significance level of the comparison of means according to Student’s t-test.
screenshot-www.mdpi.com-2024.08.13-14_06_53.png
 
Last edited:

Rocket Soul

Well-known member
Front. Plant Sci., 26 September 2022
Sec. Crop and Product Physiology
Volume 13 - 2022 | https://doi.org/10.3389/fpls.2022.974018

Indoor grown cannabis yield increased proportionally with light intensity,​

"Cannabis proliferates at very high canopy LIs in indoor production environments. The increasing inflorescence (and associated cannabinoid) yield responses to high LI in this trial clearly shows the benefits to maximizing canopy-level PPFD within the economical constraints imposed by other production logistics (including input costs). " -

Potential costs and benefits of increasing light levels in commercial production​

The slope of the yield response curve relates to a crop’s phenotypic plasticity to respond to changes in environmental inputs – light intensity in this case – which will of course vary by genotype and production environment (Backer et al., 2019; Zheng and Llewellyn, 2022). Nevertheless, using the present study’s genotype as a proxy, one can estimate the payoff associated with increases in LI.


For example, increasing the PPFD by 100 μmol m–2 s–1 increases the total light integral over 45 days by 195 mol m–2. The estimated increase in yield of 51 g m–2 for 195 mol m–2 of additional lighting corresponds to a light use efficiency of 0.26 g mol–1.

The energy cost for additional lighting relies heavily on fixture efficacy, light distribution, and local cost of electricity. Most modern horticultural LED fixtures have efficacy values exceeding 2.5 μmol J–1 (i.e., 9 mol kWh–1) (Design Lights Consortium, 2022). If electricity cost was 0.10 $CAD/kWh, the estimated energy cost in this scenario would be approximately 0.042 $CAD/g or an energy use efficiency of approximately 2.4 g kWh–1 (for lighting). The increases in fixture efficacy in modern horticultural LEDs (Kusuma et al., 2020) may explain two-times higher estimated energy use efficiency in the present study vs. estimates from scientific studies in past decades (EMCDDA, 2012). At the current wholesale price for dried inflorescence of 4.00 $CAD/g (Cannabis Benchmarks, 2022), the added electricity cost of increasing yield by increasing LI comprises only ≈1% of the total price, and therefore may make economic sense. However, the costs of additional lighting infrastructure and ancillary costs such as heat management and higher crop production inputs must also be considered when assessing the potential profitability associated with any lighting strategy.

View attachment 19047530 Table 3. Cannabinoid and total terpene content (mg g–1) of dry composite inflorescence samples of Cannabis sativa ‘Meridian’ plants grown under light emitting diodes (LEDs) for 45 days with average canopy-level photosynthetic photon densities (PPFD) of either 600, 800, or 1,000 μmol m–2 s–1 for 12 h day–1 or PPFD of 600 μmol m–2 s–1 plus ultraviolet (UV, 280–400 nm) from either UVA (12 h day–1 of 50 μmol m–2 s–1 from LEDs with peak wavelength of 385 nm for 45 days) or UVA + UVB [5 h day–1 of 3 μmol m–2 s–1 of wideband UV fluorescent lighting for the last 20 days of the flowering cycle (UVA+UVB)].

UV AFFECTING YIELD POTENCY TERPENES AND RESINS THIS IS IN A DIFFERENT PAPER
DO NOT DISREGARD UV LIGHT... THE OTHER PAPER FINDS ITS STRAIN DEPENDENT
SOME STRAINS RESPOND OTHER DONT 🤷‍♂️


That table is not easy to read, could you send me the uv paper? Its impossible to interpret without knowing what each column means. DW /FW and f/nf is not explained.
This is not showing any any conclusive effects of uv, but does indicate that high ppfd increase values, but no point to go into it before i can read it properly. Problem is that the condition with more 'noise' in the numbers is the condition that they compare uv with. If you pass me the paper i can tell you more cause there are good indications towards how to actually get results.

Also some problems with methodology: this is measured after 45 days, most strains are 55-70.
 

Rocket Soul

Well-known member

Longer Photoperiod Substantially Increases Indoor-Grown Cannabis’ Yield and Quality:

A Study of Two High-THC Cultivars Grown under 12 h vs. 13 h Days

Plants 2024, 13(3), 433; https://doi.org/10.3390/plants13030433

Figure 1. Elapsed days to flowering (EDTF) responses to 12 h (filled bars) and 13 h (empty bars) photoperiod treatments of C. sativa cultivars ‘Incredible Milk’ (IM) and ‘Gorilla Glue’ (GG). Data are means ± SE, n = 3. Error bars are presented for all data but may be obscured for small SE values. Percentage values marked in the 13 h bars signify the increase in EDTF relative to the 12 h treatment, and the p-values above each cultivar represent the significance level of the comparison of means according to Student’s t-test.
Plants 13 00433 g002

Figure 2. Representative photos showing early apical inflorescence development of C. sativa cultivars ‘Incredible Milk’ (IM) and ‘Gorilla Glue’ (GG) under 12 h and 13 h photoperiod treatments from 14 d to 21 d after the start of photoperiod treatments.
Plants 13 00433 g003

Figure 3. Temporal dynamics of stigma browning on the apical inflorescence of the primary shoot of C. sativa cultivars ‘Incredible Milk’ (IM, black) and ‘Gorilla Glue’ (GG, red) grown under 12 h (triangles) and 13 h (circles) photoperiod treatments. Data are means ± SE of three replicates (n = 3). Error bars are presented for all data but may be obscured for small SE values.

3.2. Inflorescence Yield​

There were no photoperiod treatment effects on apical inflorescence DW in GG, but the apical inflorescence DW in IM more than doubled under the 13 h vs. 12 h treatments (Figure 4 and Figure 5).
Plants 13 00433 g004

Figure 4. Dry weight responses of individual plants’ apical inflorescence to 12 h (filled bars) and 13 h (empty bars) photoperiod treatments of C. sativa cultivars ‘Incredible Milk’ (IM) and ‘Gorilla Glue’ (GG). Data are means ± SE, n = 3. Error bars are presented for all data but may be obscured for small SE values. Percentage values marked in the 13 h bars signify the increase in apical inflorescence dry weight relative to the 12 h treatment, and the p-values above each cultivar represent the significance level of the comparison of means according to Student’s t-test.
Plants 13 00433 g005

Figure 5. Images of the apical inflorescence of the primary shoot of representative plants at harvest of C. sativa ‘Incredible Milk’ (IM) plants on day 58 and of ‘Gorilla Glue’ (GG) on day 72 after the start of the photoperiod treatments. The white scale bars in each image are 5 cm.
There were no photoperiod treatment effects on apical inflorescence density in GG, but the apical inflorescence density of IM was 36% lower in the 13 h treatment (Figure 6).

Conclusions

The 13 h photo period treatment increased inflorescence yield disproportionately higher than the increase in DLI in both cultivars. In addition, while the longer photo period somewhat delayed inflorescence development, the major cannabinoid concentrations in the apical inflorescence tissues at commercial maturity were either unchanged or enhanced. Therefore, increasing the photo period during the flowering stage of indoor cannabis cultivation is an easily employed cultivation protocol for enhancing indoor cannabis production. However, cannabis’ photo period responses are strongly cultivar-dependent; growers must investigate the effects of photo periods with their own specific cultivars and cultivation systems.
Figure 1. Elapsed days to flowering (EDTF) responses to 12 h (filled bars) and 13 h (empty bars) photoperiod treatments of C. sativa cultivars ‘Incredible Milk’ (IM) and ‘Gorilla Glue’ (GG). Data are means ± SE, n = 3. Error bars are presented for all data but may be obscured for small SE values. Percentage values marked in the 13 h bars signify the increase in EDTF relative to the 12 h treatment, and the p-values above each cultivar represent the significance level of the comparison of means according to Student’s t-test.
View attachment 19047642
Very interesting. But the lower brown stigmas in 13 hours could indicate that the plants dont finish properly. It would be interesting to see what would happen to yield if you added one hour of minimal light to standard 12. 36% lower density in one of the 13 hour groups is not really good.
 

acespicoli

Well-known member
That table is not easy to read, could you send me the uv paper? Its impossible to interpret without knowing what each column means. DW /FW and f/nf is not explained.
This is not showing any any conclusive effects of uv, but does indicate that high ppfd increase values, but no point to go into it before i can read it properly. Problem is that the condition with more 'noise' in the numbers is the condition that they compare uv with. If you pass me the paper i can tell you more cause there are good indications towards how to actually get results.

Also some problems with methodology: this is measured after 45 days, most strains are 55-70.

Plants 2024, 13(3), 433; https://doi.org/10.3390/plants13030433

1723588422172.png


z These values represent the percent increase in the respective parameter in the 13 h vs. 12 h photoperiod treatment; y p-values are according to Student’s t-test. x Growth index = [height × width1 × width2]/300 (Ruter, 1992) [10]. w Harvest index = total inflorescence FW/(total inflorescence FW + aboveground vegetative FW).


I like how you :thinking:


Best >>>ibes :huggg:
 

Rocket Soul

Well-known member

Plants 2024, 13(3), 433; https://doi.org/10.3390/plants13030433

View attachment 19047759


z These values represent the percent increase in the respective parameter in the 13 h vs. 12 h photoperiod treatment; y p-values are according to Student’s t-test. x Growth index = [height × width1 × width2]/300 (Ruter, 1992) [10]. w Harvest index = total inflorescence FW/(total inflorescence FW + aboveground vegetative FW).


I like how you :thinking:


Best >>>ibes :huggg:
Thx :), but its uv paper i meant. They also have some similar terms but another article.
1723556949197.png

See how theres no proper explanation of these terms, fw/dw and f and nf. Its terps and thc i guess but best to get it right. If you have the paper could you pm me it?
 
Last edited:

acespicoli

Well-known member
Thx :), but its uv paper i meant. They also have some similar terms but another article.
View attachment 19047901
See how theres no proper explanation of these terms, fw/dw and f and nf. Its terps and thc i guess but best to get it right. If you have the paper could you pm me it?
Photochemistry and Photobiology Vol. 46, No. 2, pp. 201-206, 1987 Printed in Great Britain. All rights reserved 0031-8655/87 $03.00+0.00 Copyright 0 1987 Pergamon Journals Ltd

' UV-B RADIATION EFFECTS ON PHOTOSYNTHESIS, GROWTH AND CANNABINOID PRODUCTION OF TWO Cannabis sativa CHEMOTYPES

JOHN LYDON~.*, ALAN H. TERAMURA' and C. BENJAMIN COFFMAN~ 'Department of Botany, University of Maryland, College Park, MD 20742, USA,, 2USDA-ARS, Southern Weed Science Laboratory, P.O. Box 350, Stoneville, MS 38776. USA and 'USDA-ARS, Weed Science Laboratory, AEQ. I, Beltsville, MD 20705. USA (Received 29 August 1986; accepted 24 February 1987)

UV-B RADIATION EFFECTS ON PHOTOSYNTHESIS, GROWTH and CANNABINOID PRODUCTION OF TWO Cannabis sativa CHEMOTYPES​


John Lydon, Alan H. Teramura, C. Benjamin Coffman
First published: August 1987

Abstract​


The effects of UV-B radiation on photosynthesis, growth and cannabinoid production of two greenhouse-grown C. sativa chemotypes (drug and fiber) were assessed. Terminal meristems of vegetative and reproductive tissues were irradiated for 40 days at a daily dose of 0, 6.7 or 13.4 kJ m-2 biologically effective UV-B radiation. Infrared gas analysis was used to measure the physiological response of mature leaves, whereas gas-liquid chromatography was used to determine the concentration of cannabinoids in leaf and floral tissue.
There were no significant physiological or morphological differences among UV-B treatments in either drug- or fiber-type plants. The concentration of Δ9-tetrahydrocannabinol (Δ9-THC), but not of other cannabinoids, in both leaf and floral tissues increased with UV-B dose in drug-type plants. None of the cannabinoids in fiber-type plants were affected by UV-B radiation.
The increased levels of Δ9-THC in leaves after irradiation may account for the physiological and morphological tolerance to UV-B radiation in the drug-type plants. However, fiber plants showed no comparable change in the level of cannabidiol (a cannabinoid with UV-B absorptive characteristics similar to Δ9 THC). Thus the contribution of cannabinoids as selective UV-B filters in C. sativa is equivocal.
https://doi.org/10.1111/j.1751-1097.1987.tb04757.x

Type I one plants
https://kannapedia.net/strains?report=V2&type=I&thc=gte10 THC greater than 10 ;)
V2 tests thcas synthase genes not cancellations due to cbd
full active thcas coverage complete inactive cbdas on the graph :huggg:
 
Last edited:

Rocket Soul

Well-known member
Front. Plant Sci., 26 September 2022
Sec. Crop and Product Physiology
Volume 13 - 2022 | https://doi.org/10.3389/fpls.2022.974018

Indoor grown cannabis yield increased proportionally with light intensity,​

"Cannabis proliferates at very high canopy LIs in indoor production environments. The increasing inflorescence (and associated cannabinoid) yield responses to high LI in this trial clearly shows the benefits to maximizing canopy-level PPFD within the economical constraints imposed by other production logistics (including input costs). " -

Potential costs and benefits of increasing light levels in commercial production​

The slope of the yield response curve relates to a crop’s phenotypic plasticity to respond to changes in environmental inputs – light intensity in this case – which will of course vary by genotype and production environment (Backer et al., 2019; Zheng and Llewellyn, 2022). Nevertheless, using the present study’s genotype as a proxy, one can estimate the payoff associated with increases in LI.


For example, increasing the PPFD by 100 μmol m–2 s–1 increases the total light integral over 45 days by 195 mol m–2. The estimated increase in yield of 51 g m–2 for 195 mol m–2 of additional lighting corresponds to a light use efficiency of 0.26 g mol–1.

The energy cost for additional lighting relies heavily on fixture efficacy, light distribution, and local cost of electricity. Most modern horticultural LED fixtures have efficacy values exceeding 2.5 μmol J–1 (i.e., 9 mol kWh–1) (Design Lights Consortium, 2022). If electricity cost was 0.10 $CAD/kWh, the estimated energy cost in this scenario would be approximately 0.042 $CAD/g or an energy use efficiency of approximately 2.4 g kWh–1 (for lighting). The increases in fixture efficacy in modern horticultural LEDs (Kusuma et al., 2020) may explain two-times higher estimated energy use efficiency in the present study vs. estimates from scientific studies in past decades (EMCDDA, 2012). At the current wholesale price for dried inflorescence of 4.00 $CAD/g (Cannabis Benchmarks, 2022), the added electricity cost of increasing yield by increasing LI comprises only ≈1% of the total price, and therefore may make economic sense. However, the costs of additional lighting infrastructure and ancillary costs such as heat management and higher crop production inputs must also be considered when assessing the potential profitability associated with any lighting strategy.

View attachment 19047530 Table 3. Cannabinoid and total terpene content (mg g–1) of dry composite inflorescence samples of Cannabis sativa ‘Meridian’ plants grown under light emitting diodes (LEDs) for 45 days with average canopy-level photosynthetic photon densities (PPFD) of either 600, 800, or 1,000 μmol m–2 s–1 for 12 h day–1 or PPFD of 600 μmol m–2 s–1 plus ultraviolet (UV, 280–400 nm) from either UVA (12 h day–1 of 50 μmol m–2 s–1 from LEDs with peak wavelength of 385 nm for 45 days) or UVA + UVB [5 h day–1 of 3 μmol m–2 s–1 of wideband UV fluorescent lighting for the last 20 days of the flowering cycle (UVA+UVB)].

UV AFFECTING YIELD POTENCY TERPENES AND RESINS THIS IS IN A DIFFERENT PAPER
DO NOT DISREGARD UV LIGHT... THE OTHER PAPER FINDS ITS STRAIN DEPENDENT
SOME STRAINS RESPOND OTHER DONT 🤷‍♂️


So i promised to look at this paper, its nice but not a uv slamdunk.
The table you showed is not potency as i understood, its yield. But theres some real nice info though if you look at it closely.

- the conditions were plants grown under 1000/800/600/600+50UVA/600+3ish uva+uvb. All numbers are ppfd. Lets call the conditions A thru D.

There are statisical significant trends and some nonsignificant trends or info, lets see both. Also lets have a look at variance and how this could be guide research or ideas.

The table shows 2 lines with some statistical significant results. DW and FW, dry and fresh/wet yield. Its not really the numbers we should be looking at but the a,b,c - these indicate groups of conditions which could not be shown as being different from eachother. If something is in 'a' group and has higher yield, we know that this is not due to random errors, it really is a real difference to 'b' and 'c' groups. But some are also in both a and b. The confidence intervall is 95 %, it means we know this to a 95% certainty.

When theres no groups it means even if numbers maybe looked different there was to much variance and randomness in the test results to be able to get to this 95% level of confidence in the results. This all done by measuring each plants yield and doing some statistical tests, iirc its called the T-test.

Variance is the number of +-, the higher it is the harder it is to prove that this condition is different to any other. It makes the condition "want" to be in the other groups. The highest variance is on the C/600 condition, so we can draw the conclusion: ALLWAYS DO YOUR RESEARCH USING MORE RATHER THAN LESS LIGHT IF YOU WANT SIGNIFICANT CONSLUSIONS. Makes it look stupid to have added uv to 600ppfd rather than adding it to more intense light conditions.

Significant trends:
More light gives more yield. Big whoop and duh... Higher light A and B are both in the separate 'a' group. But B/800 was not significant different to D and E: 600+ both uv conditions. This all in dry weight which is what most concerns us, all three in 'b' group. While C/600 was not in in this b group, but in group 'c' together with D and E/uv conditions.
This is really interesting to me: IT SHOWS A TREND OF UV NOT LOWERING YIELD. At least when added to the spectrum of this test which was pretty much blurple. You could argue that condition D had higher intensity than C by 50 ppfd of uv which could make up for any blue related yield loss (blue generally considered to be a drawback on yield). But then again, the E condition just added very little ppfd but in a wider range, uva and uvb. AND IT STILL WAS NOT DIFFERENT FROM THE B/800 GROUP.

If we wanna compare this to that valoya study about blue and yield which found linear decrease in yield as blue went up:
They compared HPS and different led spectrums with different blue content. HPS was high yield but blue content was not the only difference to the leds, it also added IR and a lot of other things. This could be why yield was so high, we cant establish for sure that it was due to blue content and not other differences, only that HPS was high yield.
The rest of the led conditions had different blue content but always added thru more 450nm blue and yield was decreasing.
Extrapolating the two results:
- THE SPECTRAL CHARACTER OF THE BLUE (or uv) YOU ADD IS IMPORTANT TO THE YIELD RESULTS, WITH A TREND TOWARDS EXPANDING BLUE SPECTRUM IF ANYTHING INCREASES YIELD RATHER THAN DECREASE YIELD! If 600+3ish of uva+uvb increase yield over plain 600 (even if 600 is the high variance condition in the study, the condition that "wants" to be grouped with the rest of the conditions), then im ready to bet that that you can add uv or violets with no yield loss, just as long as you do it in a well thought out way. Blue trends towards yield loss but its not a surefire case, if your extra blue expands your spectrum in the right way. The right way? Further research i guess... But do that research by adding uv to 800-1000ppfd.

Another issue here is that D and E conditions were not applied in the same way: D/uva was added the whole day while E/uvb was only for 5 hours. This means we dont know if E seemingly overperforming (it only adds 0.5% of light intensity) would be due to the spectrum or to that it was only on during the 5 midday hours, but this could also be tested i guess. In any case : NO CLEAR CASE AGAINST ADDING UV WITH REGARDS TO YIELD. If you add uv and find that tadte and smell is better (which is incredibly clear to me that tried it, along with anyone ive done blind test with) then uv has indeed made a relative benefit to your crop.

As for THC: only small trends, only significant increase in THC was in sugar leaves, not dry buds. But thats still something for the hash makers :)

Im going to tag @Ca++ , not to argue about it cause it tires us both, but i think you actually would like to see the contrasting data, you seem to be someone curious and datadriven (though a bit stubborn) :)
Its not yet safe to say in a very generalized way from this, this test was all done with blurple which is not what we use today.
The point is: not finding statistical significant differences is not the same as proving no effect (this is the missread most people do on bugbees paper)- it just means that between the results being small and there always being some errors introduced we cant show a a statistical significant (to 95% certainty) difference in results.

Here there was an effect shown in thc (though marginal i admitt) AND trend towards yield increase when adding uv. This trumps a no result test, since no result is just no result, not proof of a negative. And tbh, the confidence intervall of 95% is quite high in my opinion; at least for our own grow. Say there was a 75% chance that uv would improve both yield and potency i your grow, wouldnt you take it?
The caveat would be that your grow mixes hps and leds, the hps already gives a very slim coverage of those missing blues/violets and uv which should be able to activate some genetic pathways even in the most basic minimal way. Who knows what it would do for you?

But to me that says lets go and find out, especially since a basic try out test is so cheap nowadays, once one got comfy with a soldering iron and some monodiodes. Best vibes :)
 

acespicoli

Well-known member
1729817285991.png

Tarantula Borg​


Top Features

  • Designed for Commercial Production, Vertical Racks, Medical Gardens, 5x5 Tents
  • Featuring the Samsung LM301H Diodes & LM301H EVO & EVO Mint White
  • Osram 450nm + Osram 660nm + Osram 730nm
  • 4 Channel (Cool White, Warm White, 660nm, 730nm)
  • IP66 Waterproof
  • Folding Design for fast and easy installation
  • Potentiometer for each channel for Manual control
  • RJ45 Port
  • 60 Preset Spectrums and can adapt to over 500 Spectrums with the Grand Master LEDs Controller (phone application pending)
  • Inventronics Drivers
  • 5 Year Warranty
Download Manual

Specifications

Max Wattage1500 Watts 240V
Voltage Range120-277 Volt & 480V available
Flowering Footprint5' x 5'
System PPF Efficacy2.88 umol/joule
Total output4,412 PPF
Dimensions46" x 46"
Weight54.78 lbs
Recommended Mounting Height12-30 inches above canopy depending on wattage
CertificationsETL, IP66, DLC
 

CocoNut 420

Well-known member
I nearly bought a multi channel light a while back, I like the idea of plenty blue early on and more yellow into flower.

I wasn't sure about reliability of multi circuit lights that was the deciding factor but I'd still be up for one at the right price.
 

Creeperpark

Well-known member
Mentor
Veteran
View attachment 19089132

Tarantula Borg​


Top Features

  • Designed for Commercial Production, Vertical Racks, Medical Gardens, 5x5 Tents
  • Featuring the Samsung LM301H Diodes & LM301H EVO & EVO Mint White
  • Osram 450nm + Osram 660nm + Osram 730nm
  • 4 Channel (Cool White, Warm White, 660nm, 730nm)
  • IP66 Waterproof
  • Folding Design for fast and easy installation
  • Potentiometer for each channel for Manual control
  • RJ45 Port
  • 60 Preset Spectrums and can adapt to over 500 Spectrums with the Grand Master LEDs Controller (phone application pending)
  • Inventronics Drivers
  • 5 Year Warranty
Download Manual

Specifications

Max Wattage1500 Watts 240V
Voltage Range120-277 Volt & 480V available
Flowering Footprint5' x 5'
System PPF Efficacy2.88 umol/joule
Total output4,412 PPF
Dimensions46" x 46"
Weight54.78 lbs
Recommended Mounting Height12-30 inches above canopy depending on wattage
CertificationsETL, IP66, DLC
1500 watts is a lot of watts. A little too much for me but I bet it will kick ass.
 
Top