What's new
  • ICMag with help from Phlizon, Landrace Warden and The Vault is running a NEW contest for Christmas! You can check it here. Prizes are: full spectrum led light, seeds & forum premium access. Come join in!

LED Growers Unite, Who makes the BEST LED and how long has it lasted ? Cast Your Vote!!!

in Who makes the BEST LED ???


  • Total voters
    93

acespicoli

Well-known member


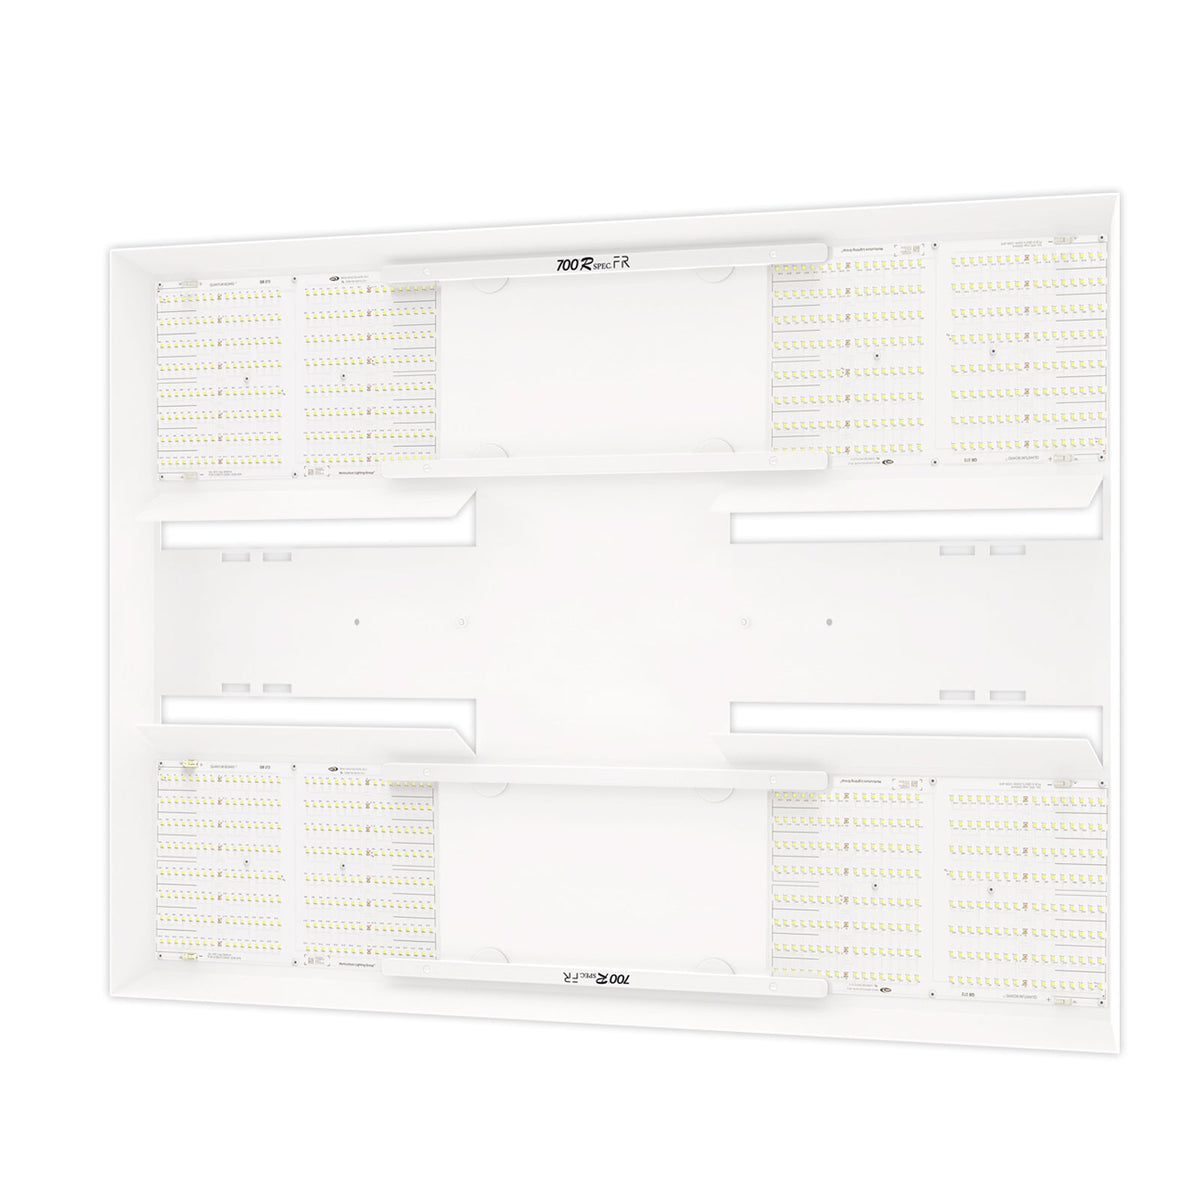
Specifications

Power Options650 Watts, 720 Watts, 750 Watts
Input Voltage Options120-277VAC or 277-500VAC
AC NEMA Plug Options5-15, 5-20, 6-15, 6-20, L7-15, L7-20, Pigtails
Dimming0-10V with standard RJ11 cable
Flowering Footprint5' x 5' at 15" - 24"
Veg Footprint6' x 6' at 30” - 36"
Dimensions38.75" x 36.125" x 3.25"
Product Weight24.15 lbs
Recommended Mounting Height15-24 inches above canopy
CertificationsUL 8800, UL 1598, CSA, DLC
These lamps produce over 2090/2200 PPF output to maximize yields.

CertificationsUL 8800, UL 1598, CSA, DLC
OH WELL ENOUGH OF THAT AND COMMERCIAL EXAMPLES FOR NOW 🤷‍♂️
WANNA ADD BRIDGELUX AND WHAT ELSE HAVE YOU ? :thinking:
Industry-standard 2835 footprint

screenshot-drive.google.com-2024.08.21-14_57_17.png

PAGE 10 FROM SSL LINK INVALUABLE EDU JUNE 2020 HIGHLY RECOMMENDED READING
 
Last edited:
  • Like
Reactions: Gry

acespicoli

Well-known member
1724268972103.png

Figure 4 Effects of spectrum and PPFD on yield and light use efficiency of Cannabis sativa. (A) inflorescence dry weight; (B) inflorescence density; (C) inflorescence light use efficiency; (D) plant height; (E) and plant dry weight and partitioning. Bars indicate means of two blocks (n = 2) each consisting of 9 replicate plants. Main effects are shown when no interaction is found. Error bars represent standard error of means (SEM). Different letters (within lowercase and uppercase) indicate significant differences between treatments (Fisher’s unprotected LSD test, P = 0.10).

The role of red and white light in optimizing growth and accumulation of plant specialized metabolites at two light intensities in medical cannabis (Cannabis sativa L.)
Front. Plant Sci., 17 June 2024
Sec. Crop and Product Physiology
Volume 15 - 2024 | https://doi.org/10.3389/fpls.2024.1393803

Light fixture efficiency​

UnitCalculation
Daily light integral (DLI)0.0036 × PPFD (μmol⋅m−2⋅s−1) × duration of exposure
Photosynthetic photon efficacy (PPE)Photosynthetic photon flux (PPF) μmol/W


CategoryTypeOverall luminous
efficacy (lm/W)
Overall luminous
efficiency[note 4]
Ideal sourcesGreen light at 555 nm (maximum possible luminous efficacy by definition)683.002[11][54]100%
Light-emitting diodeTheoretical limit for a white LED with phosphorescence color mixing260–300[31]38.1–43.9%
Ideal sourcesTruncated 5800 K black-body[note 7]251[9]37%
Light-emitting diode21.5 W LED retrofit for T8 fluorescent tube (230 V)172[30]25%
Gas discharge1400 W sulfur lamp100[46]15%
Gas dischargeLow-pressure sodium lamp100–200[18][48][49][50]15–29%
CathodoluminescenceElectron-stimulated luminescence30–110[52][53]15%
Light-emitting diodeLED screw base lamp (120 V)102[24][25][26]14.9%
FluorescentT8 tube with electronic ballast80–100[38]12–15%
FluorescentPL-S 11 W U-tube, excluding ballast loss82[42]12%
Gas dischargeHigh-pressure sodium lamp85–150[18]12–22%
Light-emitting diode5–16 W LED screw base lamp (230 V)75–212[27][28][29]11–31%
FluorescentT5 tube70–104.2[43][44]10–15.63%
Fluorescent70–150 W inductively-coupled electrodeless lighting system71–84[45]10–12%
Gas dischargeMetal-halide lamp65–115[47]9.5–17%
Fluorescent32 W T12 tube with magnetic ballast60[38]9%
Arc lampUltra-high-pressure (UHP) mercury-vapor arc lamp, free mounted58–78[36]8.5–11.4%
Fluorescent9–32 W compact fluorescent (with ballast)46–75[18][39][40]8–11.45%[41]

Accuracy of Quantum Sensors Measuring Yield Photon Flux and Photosynthetic Photon Flux​

screenshot-journals.ashs.org-2024.08.21-16_02_53.png

Abstract. Photosynthesis is fundamentally driven by photon flux rather than energy flux,
but not all absorbed photons yield equal amounts of photosynthesis. Thus, two measures
of photosynthetically active radiation have emerged: photosynthetic photon flux (PPF),
which values all photons from 400 to 700 nm equally, and yield photon flux (YPF), which
weights photons in the range from 360 to 760 nm according to plant photosynthetic
response. We selected seven common radiation sources and measured YPF and PPF from
each source with a spectroradiometer. We then compared these measurements with
measurements from three quantum sensors designed to measure YPF, and from six
quantum sensors designed to measure PPF. There were few differences among sensors
within a group (usually <5% ), but YPF values from sensors were consistently lower (3 %
to 20 %) than YPF values calculated from spectroradiometric measurements. Quantum
sensor measurements of PPF also were consistently lower than PPF values calculated from
spectroradiometric measurements, but the differences were <7% for all sources, except
red-light-emitting diodes. The sensors were most accurate for broad-band sources and
least accurate for narrow-band sources. According to spectroradiometric measurement,
YPF sensors were significantly less accurate (>9% difference) than PPF sensors under
metal halide, high-pressure sodium, and low-pressure sodium lamps. Both sensor types
were inaccurate (>18% error) under red-light-emitting diodes. Because both YPF and
PPF sensors are imperfect integrators, and because spectroradiometers can measure
photosynthetically active radiation much more accurately, researchers should consider
developing calibration factors from spectroradiometric data for some specific radiation
sources to improve the accuracy of integrating sensors
Article Category: Research ArticleOnline Publication Date: Dec 1993
Page(s): 1197–1200Volume/Issue: Volume 28: Issue 12
Copyright: © American Society for Horticultural Science 1993DOI: https://doi.org/10.21273/HORTSCI.28.12.1197
 
Last edited:
  • Like
Reactions: Gry

acespicoli

Well-known member


THIS IS THE WHITE LIGHT RANKED BY LUMEN/WATT EFFICIENCY AS TESTED
NOTE: THERE MAY BE OTHER AND THIS DOES NOT LIST REBRANDED
THIS LINK MAY BE MORE HELPFUL FOR YOU AS THIS IS A SNAPSHOT 9/2024


screenshot-downloads.cree-led.com-2024.08.21-20_50_56.png


https://led.samsung.com/about-us/news-events/news/news-detail-49/
Samsung’s New Horticulture LED Lineups:
ProductSizeLight ColorPPF**PE***Condition
LM301H3.0 x 3.0 mmWhite0.54 μmol/s3.03 μmol/J65 mA, 25℃
LM561H5.6 x 3.0 mm0.50 μmol/s2.88 μmol/J
LH351H3.5 x 3.5 mmWhite2.52 μmol/s2.56 μmol/J350 mA, 25℃
Royal Blue (450 nm)2.80 μmol/s2.80 μmol/J
Deep Red (660 nm)2.32 μmol/s3.16 μmol/J
Far Red (730 nm)0.22 μmol/s0.33 μmol/J
Horticulture Linear281.0 x 41.0 mmWhite70.90 μmol/s2.74 μmol/J1.2 A, 25℃
 
Last edited:
  • Like
Reactions: Gry

acespicoli

Well-known member

Nov 7, 2021
The ultimate lighting solutions for plant growth


HLG
 
Last edited:
  • Like
Reactions: Gry

acespicoli

Well-known member

QB288 V2 & V2 Rspec Board Guide​


QB 288 V2 and QB 288 V2 R spec have 50V-54V DC forward voltage and same driver options will work for all.
DO NOT wire different version boards in parallel. For parallel wiring it has to be all QB 288 V2 R spec or all QB 288 V2 or all QB 288 V1 boards on a driver.
High efficiency boards designed for Horticulture Lighting projects. No Thermal Interface Material is required between the QB board and flat metal heatsink.

Specifications​

  • 288pcs Samsung 301H
  • Connectors rated 300V 9A
  • Estimated LER 321.60 lm/W
  • Estimated QER 4.86 µmol/J
  • Dimensions 6.833" x 11.25
  • Max current per board 3000mA

Flux Characteristics with QB 288 V2 3000K at 55C
VDCCurrent (mA)Watts at BoardLm/W at Board (55C)μmoles/joule at Board (55C)
45.7250022.862063.00
46.98105049.33196.102.85
47.70140066.78190.502.77
48.962100102.82180.772.63
49.502400118.80177.502.58
49.862800139.60173.802.53
  • Allow tolerance of an additional 1V while matching drivers.
  • Please use this as a reference only.
May require an Aluminum plate or heatsink if running 50+ watts. Heatsink requirements depends on application and power.
While using multiple boards, series wiring is preferable to avoid thermal runaway if a board gets disconnected.

Popular Driver​


Driver Notes (Single and Multiple Parallel Boards)​

Non Dimmable
Dimmable (Plastic Case)
Dimmable (MetalCase)

Parallel Wiring​

Multiple Boards can be wired in parallel. Different batches of boards may have slightly different voltages. Use only boards from same batch for parallel connection. Do not use different spectrum boards in parallel as they may have slightly different voltages
Tip: Avoid daisy chaining multiple boards as shown in the 2nd image below. This causes first board to handle a large current and can reduce life of board's electrical trace. Wiring as shown in 1st image is preferable.
Parallel wire QB


Series Driver Notes​

Non Dimmable
Dimmable

Series Wiring​

Maximum 5 Boards can be wired in series. More than 5 boards in series will exceed the recommended maximum voltage of the board connectors and is not recommended.
Series Boards

NOTE: Boards purchased in multiple orders may be from different batches may have different voltages and may not work share equal current if connected in parallel. Use them in series to avoid some boards pulling more current than others.

Parallel-Series Wiring (Advanced)​

It is possible to have partial benefits of parallel and series together using some driver configurations. For example HLG-320H-C2800 with 2 parallel string of 2 boards in series.


BIG UP (y) TO THE SHARE OF THIS HAD SOME TIME TO LOOK AT AND THANKS :huggg:
https://www.customledpcb.com/custom-led-pcb_l7501_p.html
THE HLG QB DIY LOOK INTERESTING BUT DATED ? MAYBE THERE ARE MORE ?
IM STILL LOOKING FOR THE BEST DIY LED BOARDS THAT DISH OUT COMMERCIAL POWER
 
Last edited:
  • Like
Reactions: Gry

acespicoli

Well-known member

Conversion - PPFD to Lux​

NOTE: The conversion from PPFD (µmol m-2 s-1) to Lux varies under different light sources. For a complete discussion please see the reference listed below.
PPFD (µmol m-2 s-1) to Lux
Light SourceConversion Factor
Sunlight54
Cool White Fluorescent Lamps74
Mogul Base High Pressure Sodium Lamps82
Dual-Ended High Pressure Sodium (DEHPS): ePapillion 1000 W77
Metal Halide71
Ceramic Metal Halide (CMH942): standard 4200 K color temperature65
Ceramic Metal Halide (CMH930-Agro): 3100 K color temperature, spectrum shifted to red wavelengths59
Multiply the PPFD by the conversion factor to get Lux. For example, full sunlight is 2000 µmol m-2 s-1 or 108,000 Lux (2000 ∗ 54).
Lux to PPFD (µmol m-2 s-1)
Light SourceCalibration Factor
Sunlight0.0185
Cool White Fluorescent Lamps0.0135
Mogul Base High Pressure Sodium Lamps0.0122
Dual-Ended High Pressure Sodium (DEHPS): ePapillion 1000 W0.0130
Metal Halide0.0141
Ceramic Metal Halide (CMH942): standard 4200 K color temperature0.0154
Ceramic Metal Halide (CMH930-Agro): 3100 K color temperature, spectrum shifted to red wavelengths0.0170
Multiply the Lux by the conversion factor to get PPFD. For example, full sunlight is 108,000 Lux or 2000 µmol m-2 s-1 (108,000 ∗ 0.0185).

PPFD to Lux Reference Tables​

Sunlight
If PPFD is:then, lux is:
10540
1005400
20010,800
30016,200
60032,400
100054,000
2000108,000
HPS
If PPFD is:then; lux is:
10820
1008200
20016,400
30024,600
60049,200
100082,000
2000164,000
Metal Halide
If PPFD is:then; lux is:
10710
1007100
20014,200
30021,300
60042,600
100071,000
2000142,000
Fluorescent
If PPFD is:then; lux is:
10740
1007400
20014,800
30022,200
60044,400
100074,000
2000148,000

Definitions​


Photometric Units, Illuminance​

Foot-candle: one lumen per square foot. The 16th General Conference on Weights an Measures (CGPM), Oct. 1979, decided that the candela is the luminous intensity of a source emitting monochromatic radiation of frequency 540 x 1012 Hz and radiant intensity 1/683 watt per steradian. This corresponds to 683 lumens per watt of radiation at approximately 555 nm wavelength, which is near the maximum of the standard photopic spectral luminous efficiency curve.
LUX: one lumen per square meter; differs from foot-candle by about a factor of 10.


Last edited:
  • Like
Reactions: Gry

Ca++

Well-known member
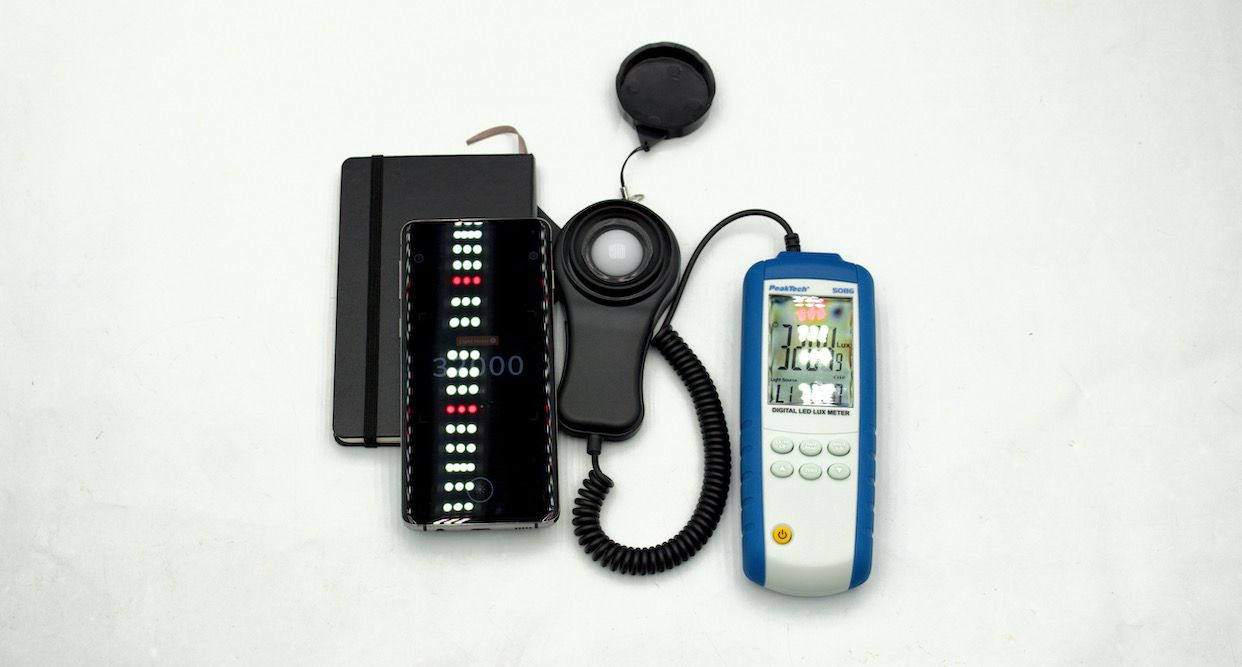
While the tables may be accurate, we should keep in mind that our lux meters are not. Two different meters might agree how many lux the sun is, which is their job. The same meters placed under LED tend to not agree anymore. Mostly because they measure just green, but different widths of the spectrum, or maybe not green, but red. There is no standard. In reality, one reading 50% more than the other, wouldn't be surprising.

As an example, when the ppfd meter reading 600, was replaced with one of my lux meters, it said 20,000 (I like the 2x3=6 relationship of that meter). My other meter said 25,000 which is just 25% different. Other meters have been knocking on 35,000 which is near double my 20,000. There is a lack of consistency, that makes using an unknown lux meter, an unknown reasult.
 

acespicoli

Well-known member
While the tables may be accurate, we should keep in mind that our lux meters are not. Two different meters might agree how many lux the sun is, which is their job. The same meters placed under LED tend to not agree anymore. Mostly because they measure just green, but different widths of the spectrum, or maybe not green, but red. There is no standard. In reality, one reading 50% more than the other, wouldn't be surprising.

As an example, when the ppfd meter reading 600, was replaced with one of my lux meters, it said 20,000 (I like the 2x3=6 relationship of that meter). My other meter said 25,000 which is just 25% different. Other meters have been knocking on 35,000 which is near double my 20,000. There is a lack of consistency, that makes using an unknown lux meter, an unknown reasult.
:thinking: Report I read a few hours ago set the average instrument at 17% deviation.
As you say if your measuring a 25% difference then that would be a type of standard ? The deviation ?
the median would be closest to no error, or in that case if you used that number 12.5% on adjustment 🤷‍♂️
Bit confusing, what is a lighting standard which is reliable, that can be used as a calibration tool ?

" lux meters" would have to be a lux standard then conversion formulas can be used across the board

maybe the matter has already been explored but how shall we implement it ?


@Ca++ there are many variables we need to address to make this a apples to apples thread
certainly where we are now is apples to oranges even among manufacturers there is sporadic standards
Besides simple PPFD PFD LUX LUMENS there are many other factors such as wavelength CRI
In the far sight is strain selection, yield in grams/watt, potency total cannabinoid content of that gram?

How much did it cost us to produce that gram figuring equipment, time, energy.....etc
Many variables that im sure were all considering ?

I envy the one who cares not and grows for joy and superior product regardless $ :ROFLMAO:
Life would be so much easier for us ?... Do love to geek on details !
Maybe this is some of what you are considering? :huggg:Appreciate you mentioning this!
The one paper DOI posted earlier is focused on this exact topic have to dig it up and add it to this post
Green light perfect standard red light error levels and calibration just as you have pointed out


https://atslab.com/calibrations/light-meter-calibrations/


This document describes the updated photometric calibration procedures for luminous intensity (candela; cd), illuminance (lux; lx), total luminous flux (lumen; lm), luminance (cd/m2 ), color temperature (Kelvin; K), and luminous exposure (lx·s, cd·s). Throughout this document, uncertainty statements follow the NIST policy given by Taylor and Kuyatt [5], which prescribes the use of an expanded uncertainty with a coverage factor k = 2 for uncertainties of all NIST calibrations. Descriptions for the individual standards and calibrations available from NIST covered by this document, as of October 2017, are listed and explained in Section 2. Updated information about calibration services and prices are published periodically in the NIST Calibration Services Users Guide and Fee Schedule [6]. The material presented in this document describes photometric calibration facilities and procedures as they existed at the time of publication. Further improvement of photometric calibration facilities and procedures are underway. Additional documents will cover new photometric calibration procedures for average LED intensity (candela; cd), LED total luminous flux of LEDs (lumen; lm), colorimetry of LEDs, and spectrally integrated total radiant flux of LEDs (watt; W), along with total spectral radiant flux calibration procedures for incandescent light sources

If we could all buy a perfect led bulb pack from the same batch from the same manufacturer
We run that led bulb of the same color temp in the same voltage same amp circuit
We measure each bulb in the pack with out app on our separate phones, what would the difference be?
Of course e need spotless cleaned glass over our CMOS sensors...

Theres alot to achieving quality data ?

Einstein and Planck your good company love the way you think :love:
Its not the answers that drive us its the questions


An object that absorbs all radiation falling on it, at all wavelengths, is called a black body.
  • Lamp black was traditionally produced by collecting soot from oil lamps.
Strategy on standard LEDs in NIST calibration services

Some NIST calibration services issue calibrated artifacts and others calibrate artifacts submitted by customers. We decided not to prepare and issue “standard LEDs” because there are so many types of LEDs and new types of LEDs are continuously being introduced, and thus, any standard LED we might develop would not satisfy many customers and would quickly become obsolete. We are committed to providing calibrations for any type of LEDs submitted by our customers, which can then be used as reference standard LEDs of the type needed in the customer’s lab. Customers are responsible to ensure the quality of LEDs submitted to NIST for calibration. Information on the NIST photometric calibration services is available on the website [14] or by contacting the authors.
 
Last edited:

acespicoli

Well-known member

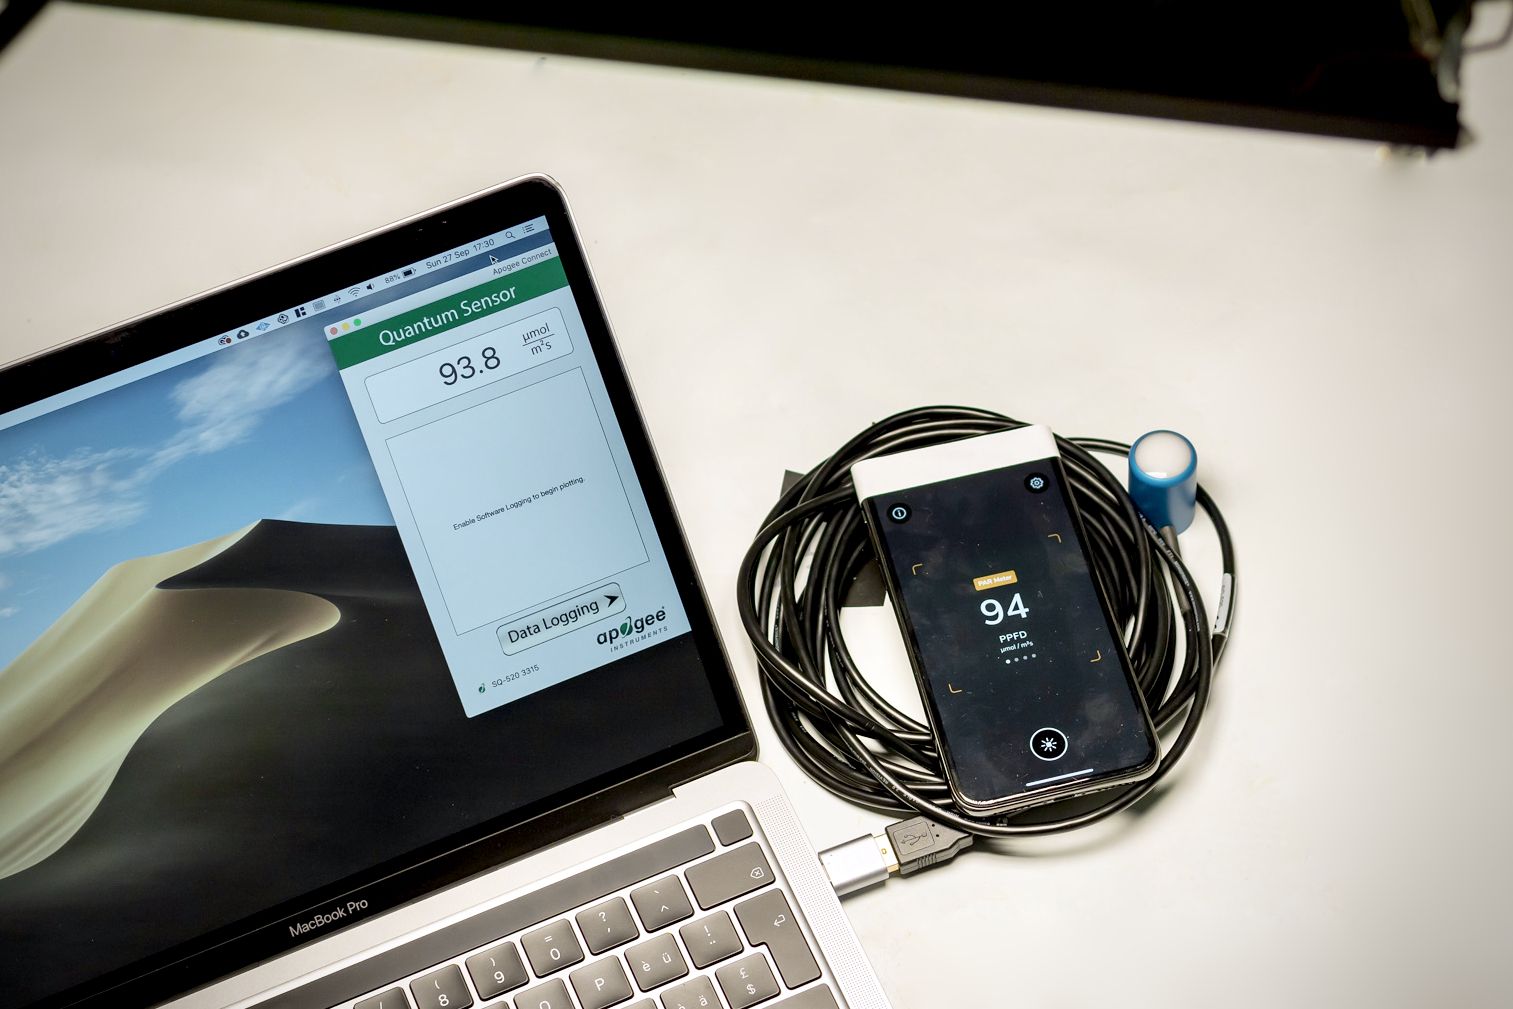
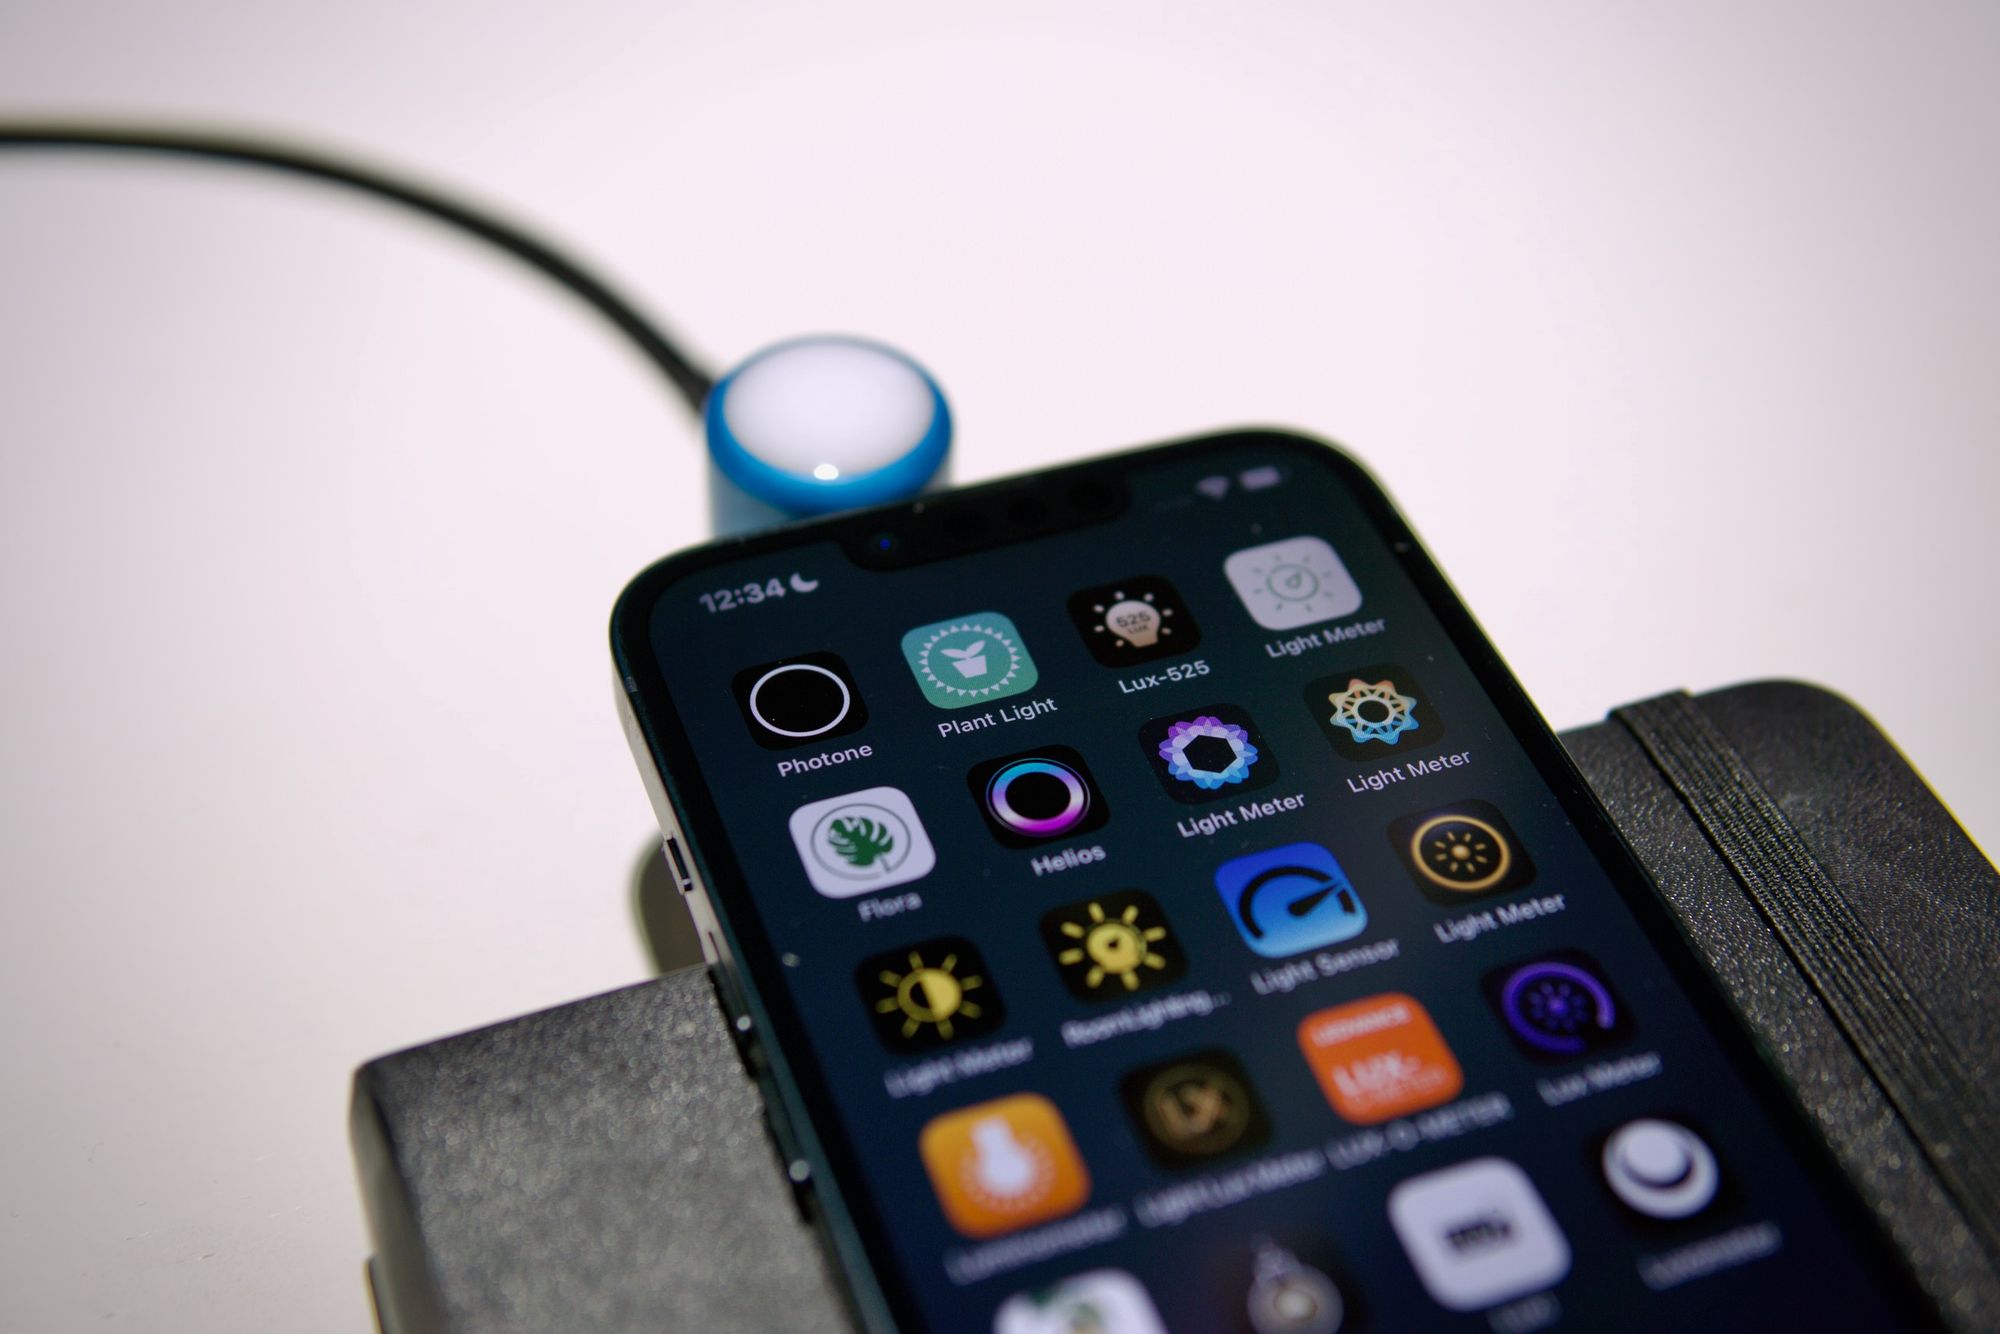
How to Calibrate Photone​

By calibrating you can align Photone’s reading to a reference
How to Calibrate Photone

Do You Need To Calibrate Photone?​

Calibration is an advanced use case, requires some know-how, and is always optional. Make sure to have read our guide on how to measure accurately before continuing:
How to Measure Accurately
Learn what affects the accuracy of the Photone Grow Light Meter

If calibrating makes sense depends on if your device already comes with a default calibration. Go to the app’s settings (⚙️-icon on the top right) and press “Calibrate Photone”. The screen will indicate if your device has a default calibration (look for the ✅-icon) or not (🟡-icon).

✅ Device With Default Calibration​

Congratulations, your device comes with a default calibration. Calibration is not recommended. Use the calibration feature only, if you wish to align Photone’s measurements to a high-quality reference light meter. Read along to find out what makes a good reference.

🟡 Device Without Default Calibration​

Your device does not come with a default calibration. Calibration is recommended, if you don’t measure what you expect and you have a reference you trust at hand. Read along to find out what makes a good reference.

How Calibration Works​

By calibrating you align a meter’s reading to a reference. Let’s say Photone measures 1230 μmol/m²/s of PPFD under your grow light, but your friend’s high-quality PAR meter says 1270 which is 3.25% more. You can now calibrate Photone with your friend’s meter as a reference. This will adjust Photone’s measurement values by +3.25% making it read equally to the reference.
ℹ️
This process only works, if a meter measures linearly (meaning that e.g. doubling the light intensity results in double the measurement). But rest assured, unlike other light meter apps Photone is built to measure linearly on all supported devices.

What Makes a Good Calibration Reference​

To calibrate, you need a reference in which you trust providing a measurement value for Photone to be aligned to. A reference could be either another light meter or a light source with a known intensity (e.g. as stated in a light output chart).

Reference Light- / PAR-Meter​

You can use any high-quality light meter that is able to measure illuminance (lux or fc) or PPFD (μmol/m²/s) as a reference. You can also use another device running Photone.
⚠️
Beware of cheap light meters. We have tested many light meters and found that, as a rule of thumb, models costing less than $150 USD are awfully inaccurate, especially when measuring grow lights.
article-calibration@3x.png
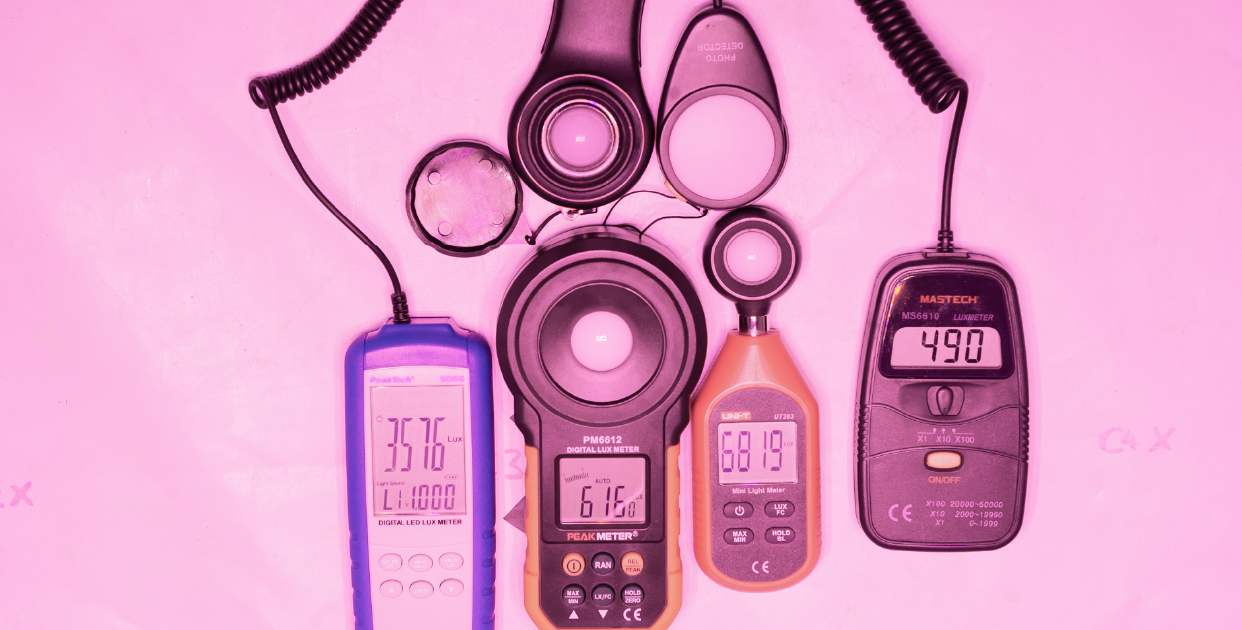
Multiple lux-meters under the same grow light showing significantly different values

Reference Light Output Chart​

Most grow lights come with a spec sheet (see the example image below) that shows how much light intensity can be expected in a specific environment (e.g. a 2x2 ft grow tent), at a given distance (e.g. 12", 18", 24"), on a given point (e.g. center square) and power setting (e.g. usually full power unless noted otherwise). You can then use these parameters to calibrate Photone if you can replicate the manufacturer’s setup.
⚠️
Note that you’d need to exactly reproduce the setup chosen in the spec sheet and you need to trust your grow light’s manufacturer. We found that some manufacturers like to inflate their values provided on the spec sheets.
photone-par-map-1.png
An example spec sheet indicating how much PPFD can be expected at a given distance

How To Calibrate​

With a reference value at hand, calibration is fairly easy. First, make sure that your lamp is warmed up and its light output has become stable. Especially fluorescent (FL) or HID-lamps (HPS, CMH, MH) have a long warmup time of roughly 15 minutes. You can test if your lamp is stable by monitoring the current measurement value (it should remain equal over one minute). Then, follow the instructions the app’s instructions after having pressed “Calibrate Photone”.

Video Guides​

To illustrate the calibration procedure, we've created the following videos showing the required steps for you:
Using a light output chart as a reference

Using a light meter as a reference

Using another device running Photone as a reference

screenshot-www.amazon.com-2024.08.22-00_27_47.png

Standard 120V 15,20amp
1724301099783.png
15$ for 20$ we have a standard ?
Theres the issue of ambient light sources and shadows, getting accurate reading etc ...
1724301335165.png

$4

Upgraded Watt Meter Power Meter Plug Home Electricity Usage Monitor, Electrical Usage Monitor Consumption, Energy Voltage Amps Kill Meter Tester with Backlight, Overload Protection, 7 Modes Display​

Visit the MECHEER Store


screenshot-growlightmeter.com-2024.08.22-01_06_39.png


Last edited:
  • Like
Reactions: Gry

acespicoli

Well-known member

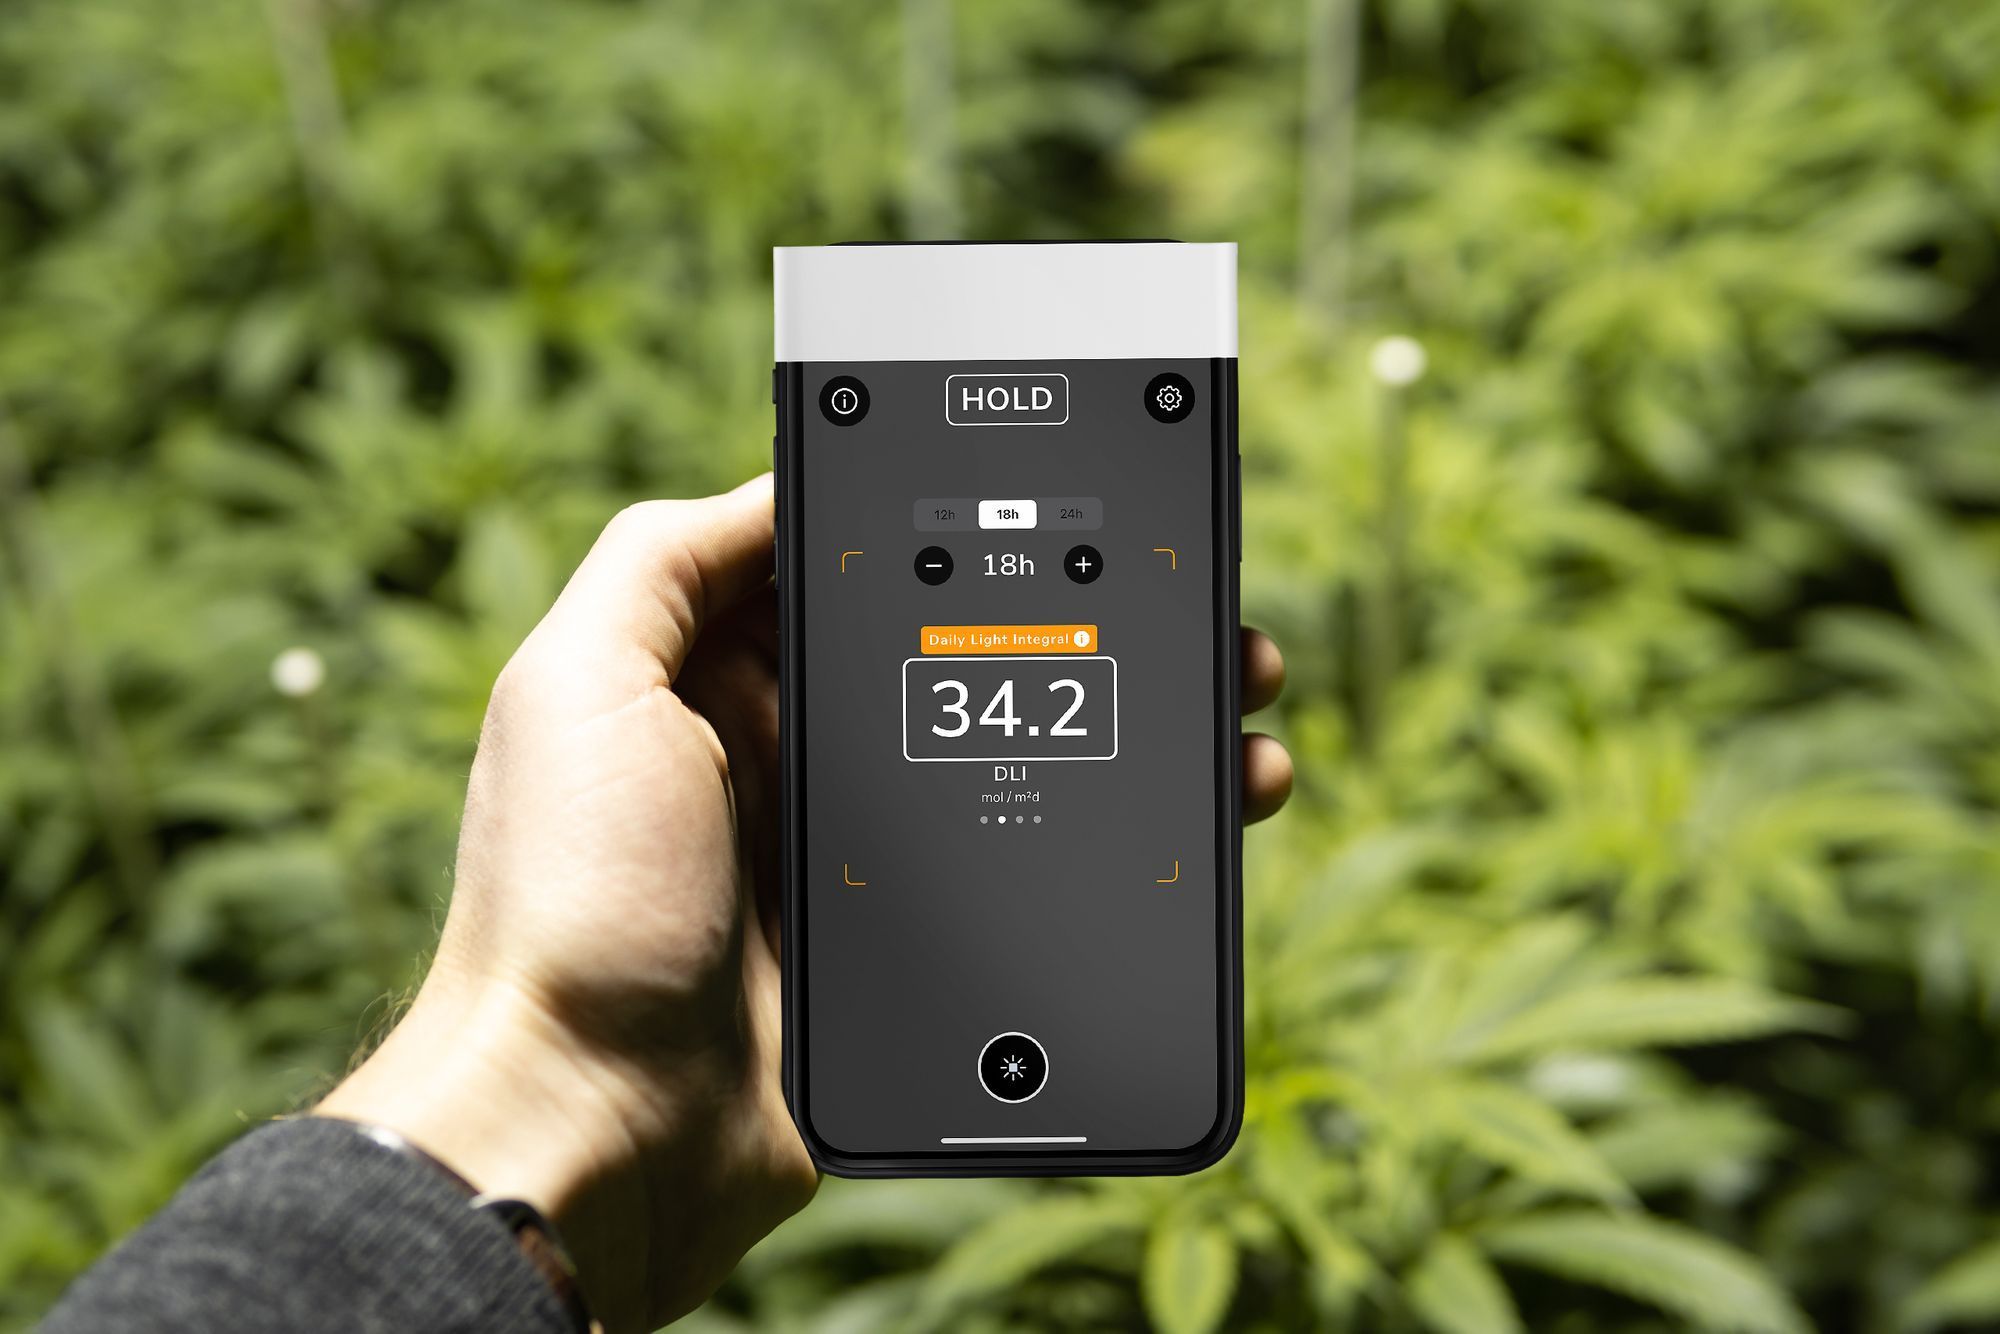
This data is a little unbelievable...

Three Models
  • DLI-400: Lowest-cost option is accurate for measuring 400-700 nm only in sunlight and under some broadband light sources.
  • DLI-500: Full-spectrum is accurate for measuring 400-700 nm under all light sources including LEDs.
  • DLI-600: ePAR is accurate for measuring the newly discovered extended PAR (ePAR) 400-750 nm range under all light sources.


From NASA Space Math

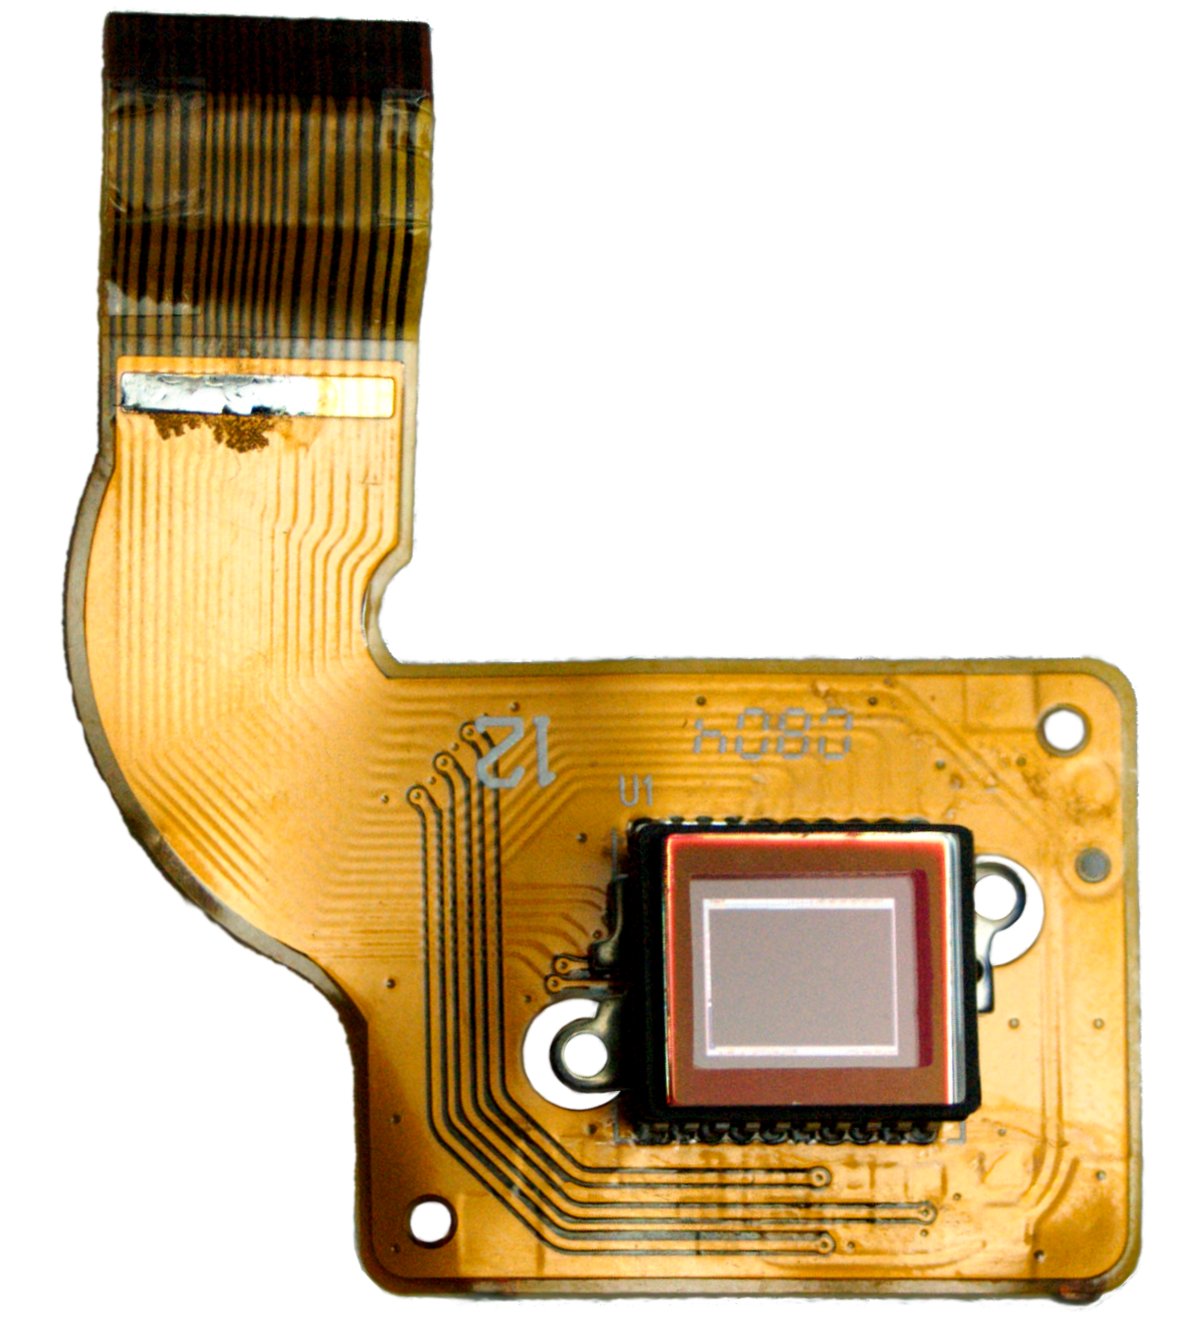
In applications with less exacting quality demands, such as consumer and professional digital cameras, active pixel sensors, also known as CMOS sensors (complementary MOS sensors), are generally used.
In a CCD image sensor, pixels are represented by p-doped metal–oxide–semiconductor (MOS) capacitors. These MOS capacitors, the basic building blocks of a CCD,[1] are biased above the threshold for inversion when image acquisition begins, allowing the conversion of incoming photons into electron charges at the semiconductor-oxide interface; the CCD is then used to read out these charges.

Although CCDs are not the only technology to allow for light detection, CCD image sensors are widely used in professional, medical, and scientific applications where high-quality image data are required.


A back-illuminated sensor contains the same elements, but arranges the wiring behind the photocathode layer by flipping the silicon wafer during manufacturing and then thinning its reverse side so that light can strike the photocathode layer without passing through the wiring layer.[7] This change can improve the chance of an input photon being captured from about 60% to over 90%,[8]


Sony, which announced the first stacked sensor in January 2012, claims a 30% increase in light captured.[20]

DOES THIS POINT TO MANY VARIABLE S, FRONT FACING REAR FACING CAMERAS ?
ALSO SENSOR TYPES VARY

Also note that the Sony Xperia PRO-I does not qualify for this list, because it only uses 60%[a] of its 1.0-type sensor.[1] The latest Leica Leitz and Sharp Aquos R series phones do qualify because, despite using only 94%https://en.wikipedia.org/wiki/List_of_large_sensor_camera_phones#cite_note-3 of their 1.0-type sensors[2][3] (with 4:3 aspect ratio), they maintain the same crop factor (2.7) and diagonal (1″) as a 1.0-type sensor with 3:2 aspect ratio, since that is the image circle for which their lenses were originally designed.


CAN WE CALIBRATE TO NOON DAY SUNLIGHT ON A CLEAR DAY ?
The Sun is about 95 million miles away in summer, but just 92 million in winter.
WE NEED A FREE TO INEXPENSIVE SOLUTION THAT IS ACCESSIBLE TO EVERYONE

BESIDES LOOKING INTO EXPENSIVE SPECIALTY EQUIPMENT,
A CALIBRATED APP MAY FILL THE GAP

screenshot-www.google.com-2024.08.22-08_29_18.png
 
Last edited:
  • Like
Reactions: Gry

acespicoli

Well-known member

Natural Sunlight Intensity​

There is a lot of information available about the light intensity needs of plants, so when purchasing grow lights, it is a relatively simple matter to specify the wattage we will need for our grow areas. However, if we are looking to supplement natural sunlight or determine how much shade we need for a greenhouse, it would help if we knew just how much natural sunlight intensity we have to work with in the first place.
At the equator, the sun’s intensity gives us a Photosynthetic Photon Flux (PPF) of 2000 µmol/m2/sec of light, which is roughly equivalent to 10,200 foot candles or 108,000 lux. As we move away from the equator however, the relative thickness of the atmosphere the light must travel through increases, and the angle of incidence “spreads out” the light, both of which decrease the light intensity. Not only does our location affect the sunlight intensity, but the time of year does, as well, as the sun is lower in the sky in winter than in summer. Fortunately, there are some simple tools that can help.
The University of Oregon Solar Radiation Monitoring Laboratory has an online Sun Chart Program that allows us to generate a solar elevation chart for your specific location, providing data for month of the year, as well as time of day. The chart for your location will look something like this:
UofRSRML.jpg

From this chart we can see, for example, that at noon on December 21st, for this specified location, the sun will only reach a maximum of 33° in elevation, while on June 21st, it can reach 80°.
Unfortunately, the relationship between solar elevation and solar intensity is a sine function and not a linear one. Fear not! By simply generating your own Sun Chart and entering the solar elevation (in degrees) in the calculator below, the maximum light intensity possible is provided.

Solar Instensity Calculator​

Determine the Maximum Sunlight Intensity Based Upon Your Location


Solar Elevation Angle
(degrees, from the "Sun Chart" you generated above)*


Maximum Solar Intensity (Approximate)

Units*
PPF
Foot-Candles
Lux


https://solardata.uoregon.edu/SunPathChart.html


So you can see that for this location, the maximum summer sunlight intensity is about 1970 µmol/m2/sec, or only about 1.5% below that of the equator, while in winter it’s only 1090 µmol/m2/sec, or 45% less.


Redefining the Second​

Because of the advantages of optical clocks in terms of accuracy, speed of comparison and remote synchronization, it is to be expected that in the not too far future the cesium clock as the fundamental timing reference will be replaced with an optical clock. This will effectively mean that the second as a fundamental SI unit will be redefined based on such a clock, then referring to an optical frequency rather than to a microwave frequency.

SUNLIGHT CLOCK... ? PRECISE STANDARDS ARE A SCIENCE
 
Last edited:

acespicoli

Well-known member
power-quality.jpg

Sine Wave Power​

In the U.S., utility companies provide power to households and offices by distributing single phase alternating current (AC) power at a frequency of 60 Hz. Electrical power can be graphically depicted as a sine wave whereby the electrical signal alternates from +120 volts to -120 volts at a rate of 60 times per second (60 Hz). To enable more efficient operation of large, heavy equipment, utility companies provide commercial and industrial locations with three phase AC power which consists of three overlapping sine waves offset by 120 degrees.
Although utility companies strive to distribute 100% sine wave power, many factors can introduce electrical noise into the AC power signal in the form of sine wave distortions and as voltage sags, surges, spikes, or other irregularities. Sine wave power is important for the optimal functioning of sensitive desktop computers and related peripheral equipment. Without sine wave power output, microprocessor-based equipment can become inoperative or sustain damage from power signal distortions.
1724331137379.png

REASONS WHY YOUR LIGHT READINGS FLUCTUATE DURING A SAMPLE
 
Last edited:

Ca++

Well-known member
I like this pic you found
article-calibration@3x.png

Is the light
A, 3600
B, 4900
C, 6200
D, 6800

This looks like a pink light QB. We could presume it's made from red and blue. Also, that meter A is looking only at pure green. With it using very tight filtering to remove other colours. In such an instance, the meter presumes all other colours are about as bright as the green it can see. Based on it's idea of what sunlight presents on a graph. So low levels of green, must in the meters opinion, mean low levels of red and blue. It's guess guessing.
The other meters may be displaying lesser filtering, or even using something other than pure green. The story of how the meters work, gets more complex until we reach a meter worth 500$ or more, that gives you a full spectral graph. A normal PPDF meter is now little more than 50$ at the low end of the market. What was highly specialised kit a few years ago, is finally getting close to mass produced consumer gear. As it should. A lux meter is 10$ if you were to buy my favourite. A cheap smart phone is 50$. What should a PPFD meter cost.
I don't expect a lab grade meter for 50$ but we are not working for NASA. Most of the time, we can't keep a hand steady enough to read to the nearest umol. We use these in the field, not on a bench. I accept a 5% deviation from the truth, as not really mattering. What slowed development, is difficulty reading 660nm and above. Even some fancy ppfd meters are guessing this, which is why we need to add correction factors, even after paying hundreds. It's important to pick the accuracy you need, rather than what's available.

You know I probably used a few lux meters, that had been beside PPDF meters to check their usefulness. I have to do some math, but it's only X3. If my meter says 20,000 I do 2x3=6 and I know it's 600umol not 60 or 6000. I can forget the zeros. This puts me very close, and competative with how close expensive meters are. Once you factor in how different LED CT changes results, and is being ignored. Non of it is really that true.
I will snag a meter that reads in umol, once a few are under 50$ and featured on youtube
 

BerryManilow

Well-known member
Don't see Grower's Choice listed yet.

I've been running the ROI-720 with the additional full spectrum UV bars.

base-image_2_3.jpg


Used HPS & MH for veg and flower for about 20 years. Waited to make the switch to LED until a few years ago.

First upgraded my veg lights to Viparspectra P1000 and they are some solid lights for veg. Zero issues and only good things to say about them. Super lightweight and covers a decent sized footprint. Healthy plants and healthy clones since I switched.

For flowering I've been using the Growers Choice for about 3 years now. I've heard their support isn't the best and some horror stories about the lights dying, but so far so good.

Biggest yield was around 2.5 lbs per light / 1.75g/w. Not in a commercial setting so those numbers are a huge difference compared to HPS.

The UV has brought out some of the frostiest flowers I've ever seen. Aeroponics is probably the frostiest, but coco and hydro are right behind.
 
  • Like
Reactions: Gry

acespicoli

Well-known member
I like this pic you found
article-calibration@3x.png

Is the light
A, 3600
B, 4900
C, 6200
D, 6800

This looks like a pink light QB. We could presume it's made from red and blue. Also, that meter A is looking only at pure green. With it using very tight filtering to remove other colours. In such an instance, the meter presumes all other colours are about as bright as the green it can see. Based on it's idea of what sunlight presents on a graph. So low levels of green, must in the meters opinion, mean low levels of red and blue. It's guess guessing.
The other meters may be displaying lesser filtering, or even using something other than pure green. The story of how the meters work, gets more complex until we reach a meter worth 500$ or more, that gives you a full spectral graph. A normal PPDF meter is now little more than 50$ at the low end of the market. What was highly specialised kit a few years ago, is finally getting close to mass produced consumer gear. As it should. A lux meter is 10$ if you were to buy my favourite. A cheap smart phone is 50$. What should a PPFD meter cost.
I don't expect a lab grade meter for 50$ but we are not working for NASA. Most of the time, we can't keep a hand steady enough to read to the nearest umol. We use these in the field, not on a bench. I accept a 5% deviation from the truth, as not really mattering. What slowed development, is difficulty reading 660nm and above. Even some fancy ppfd meters are guessing this, which is why we need to add correction factors, even after paying hundreds. It's important to pick the accuracy you need, rather than what's available.

You know I probably used a few lux meters, that had been beside PPDF meters to check their usefulness. I have to do some math, but it's only X3. If my meter says 20,000 I do 2x3=6 and I know it's 600umol not 60 or 6000. I can forget the zeros. This puts me very close, and competative with how close expensive meters are. Once you factor in how different LED CT changes results, and is being ignored. Non of it is really that true.
I will snag a meter that reads in umol, once a few are under 50$ and featured on youtube


Is the light
A, 3600
B, 4900
C, 6200
D, 6800

IMO A WOULD BE THE CLOSEST KELVIN VALUE FOR THAT EXAMPLE
5K BEING DAYLIGHT AND ABOVE BEING BLUE SPECTRUM
RGB COLOR PICKER REMEBER A PORTION OF THE POPULATION ARE COLOR BLIND


RGB produces white by mixing the three optic primary colors (Red, green, and blue) in a 1:1:1 ratio.
IF WE MIX ALL PAINT COLORS WE GET BLACK, WHAT IF WE MIX ALL LIGHT COLORS ?
IS IT REALLY WHITE OR DO OUR EYES JUST PERCEIVE IT AS WHITE LIGHT?
WHITE REFLECTS LIGHT, BLACK ABSORBS LIGHT ?

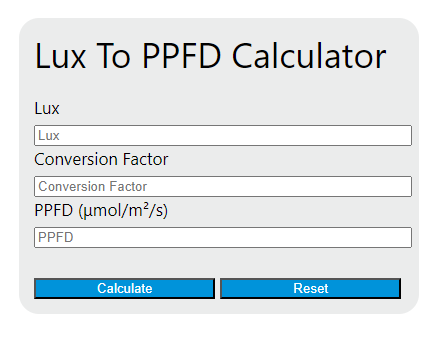
PPFD=Lux∗CF

Lux to PPFD conversions​

https://spacebuckets.com/docs/lux-ppfd-conversion

67 lux = 1 µmol/m2/sec as a generalization for all white LEDs and not taking CRI into account. The following conversions will get you within 10% for white light.​

  • 55 lux = 1 µmol/m2/sec (sunlight)
  • 63 lux = 1 µmol/m2/sec (white light - CRI 90)
  • 70 lux = 1 µmol/m2/sec (white light - CRI 80)
  • 80 lux = 1 µmol/m2/sec (HPS)
WYulYES.jpg

Comparing different lighting spectrums
Dependencies have been shown and conversion factors have been determined, which allow to estimate PPFD, YPFD and radiometric power density of white LED light according to the known illumination in lux. The most adequate estimation of the photosynthetically active white light flux is achieved if one measures the illumination E in kilolumens using a luxmeter, neglects the influence of spectral parameters, and estimates the PPFD of white LED light according to the formula: PPFD (μmol/s/m2) = 15·E (klx). Anton Sharakshane, An easy estimate of the PFDD for a plant illuminated with white LEDs

Bridgelux phosphor guide​

This section covers spectrum charts, conversion factors, and color ratios of the Bridgelux COB array LEDs. The conversion factor is luminous flux (lux) to photosynthetic photon flux density (PPFD) in uMol/m2/sec (micro moles per square meter per second) of PAR (photosynthetic active radiation 400-700nm). This is so that low cost lux meters can be used as plant lighting meters. The color ratios will not add up to 100. Blue is 400-499nm, green is 500-599nm, red is 600-699nm, far red is 700-799nm. The average wavelength of phosphor pump blue LEDs in my samples was about 453.5nm.

THIS ABOVE CHART HAS BEEN ADDED
TO THE CONVERSION SPREADSHEET FOR OUR LED WORKGROUP

https://drive.google.com/file/d/1rUK7BYtsmrdWx0hAquhIg9gze2O5t8Sp/view?usp=sharing

THERE ARE METERS THAT READ RGB AND GIVE YOU THAT OUTPUT IN THE SAME
PAR (photosynthetic active radiation 400-700nm). THIS IS THE METER RANGE USUALLY
NEAR AND FAR ENDS OF THE SPECTRUM ARE MANY TIMES NOT BEING MEASURED

BROTHER I ADDED, AM ADDING SOME CF AND FC TO THE SPREAD SHEET ON THE
CF TAB NEAR THE BOTTOM :huggg: ALSO SOME LINKS FOR ASSOCIATED READING TO KEEP EVERYONE UP TO SPEED


1724362625718.png

CAN EVERYONE READ EVERY NUMBER IN THE CIRCLE?


TAKE A PICTURE LET GIMP GIVE YOU THE RGB WITH COLOR PICKER WHAT DOES THIS TELL US?
 
Last edited:
  • Like
Reactions: Gry

acespicoli

Well-known member
AS FAR AS RGB OR ANY OF THIS FOR PPFD WHAT WERE REALLY CONCERNED WITH IS
HOW MANY PHOTONS ARE REACHING OUR PLANTS TO MAKE ENERGY IN THE PLANT

SOME PHOTONS ARE FAST MOVING AND OTHERS ARE SLOW MOVING AND THIS IS WHERE
nm COMES INTO PLAY SOME ARE USED IN CHLOROPHYLL PRODUCTION.
1724363163824.png

OTHERS MAY BE SO ENERGETIC THEY PASS RIGHT THRU THE LEAF


Chlorophyll - Wikipedia


Chlorophyll is any of several related green pigments found in cyanobacteria and in the chloroplasts of algae and plants. ... Its name is derived from the Greek ...

Chlorophyll a (Chl-a)

Chlorophyll a ... Chlorophyll a is a specific form of chlorophyll used ...

Chlorophyll b

Chlorophyll b ... Chlorophyll b is a form of chlorophyll. Chlorophyll ...

Chlorin

The name chlorin derives from chlorophyll. Chlorophylls are ...

Chlorophyll d

Chlorophyll d (Chl d) is a form of chlorophyll, identified by Harold ...

Chlorophyll c

Structure · Chlorophyll c1 molecule. Names. IUPAC name. [(2E)-3 ...

THIS IS WHY 400-700nm concern us and why we care how many PPFD hit a leaf
@Ca++ some will definately benefit from the fact you know these details and the discussion
screenshot-secondbloomauctions.com-2024.08.22-17_51_58.png

For accurate PPFD and all the variables we need a tool QS ... ?
This is in essence doing what our girls do capture electrons or photons, basic is they harvest energy
Your smart phone camera sensor is functioning in a similar way
In photonics and quantum optics, photonic quantum sensing leverages entanglement, single photons and squeezed states to perform extremely precise measurements.

You know this all gets very technical, if you wanna go down the rabbit holes.
alot of the tech is explored in this thread ^
essentially we need to know certain things about a LED purchase

It may be time we make that list ? :thinking:
 
Last edited:
  • Like
Reactions: Gry

acespicoli

Well-known member
All feedback is welcome as well as poll is always open for edits!
For someone who just came to this thread and is looking for their first LED light.
What questions would you seasoned veterans recommend they answer pertaining to their situation.

I wanna summarize this :
"who-makes-the-best-led"
in the first few pages with a post that has the details the ICfam needs to make a educated lighting choice
So they will have the poll which shows the most popular LED in 2024
and why its the choice of LED cannabis PRO's

  1. Grow room size
  2. Growth stage of tent/room seedling, clone, veg flower. Multi room ?
  3. Budget for the LED purchase
  4. Cycle operating costs, is this a concern
  5. Do you want the most light "PPFD" possible
  6. Do you want the most efficient light "lu/watt"
  7. What is the company with the best warranty reputation on diodes and drivers, units
  8. What is the best purchase for my money based on my use

  1. Is building a DIY gonna give me a edge on total PPFD or warranty
  2. Is this gonna fulfill my production needs what kinda gram/watt can I achieve with the right genetics
  3. Do I need C02, is there inexpensive ways of making generating CO2
  4. How much PPFD do I need ?
  5. Should I run my dimmer at 100%
  6. Are high temps gonna kill my LED fixture
Hopefully yall can add some more common questions
1724365894242.png


At the equator, the sun's intensity gives us a Photosynthetic Photon Flux (PPF) of 2000 µmol/m2/sec of light, which is roughly equivalent to 10,200 foot candles or 108,000 lux.
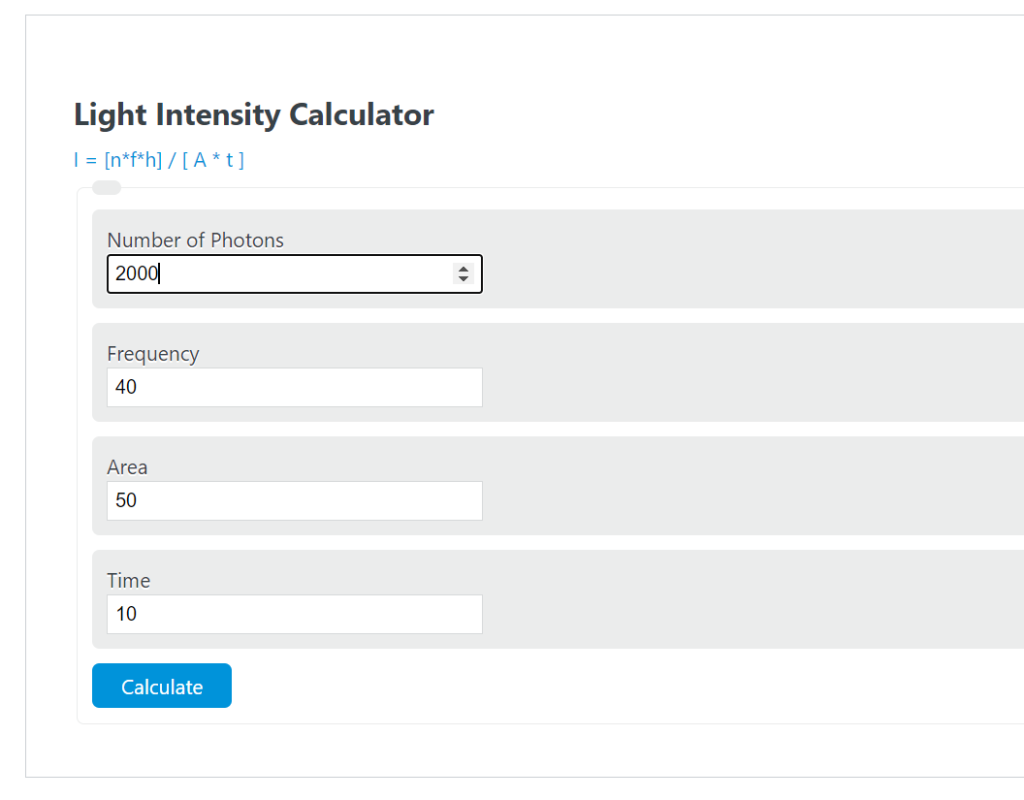
Use Calculator below to convert instantaneous PPFD µmol m-2 s-1 to DLI photosynthetic photon flux density in mol m-2 d-1

screenshot-en.wikipedia.org-2024.08.22-18_33_51.png


Enter PPFD : 2000
Enter Hours : 18

DLI: 129.60​

https://www.waveformlighting.com/horticulture/daily-light-integral-dli-calculator


1724366199179.png

Things to know
Typical CO2 levels for growing cannabis under high-PPFD (Photosynthetic Photon Flux Density) lights range from 400-1400 ppm

Without c02 enrichment yours is likely 400ppm


Variation at equator…Day length variation at equator

Image result for day length variation at equator


There are always twelve hours of daytime and twelve hours of night-time at the equator, except for two minor effects that increase daytime by about eight minutes.

Tropical strains are flowering faster at less than 12/12 hours of light 11 or even 10
screenshot-ilgmforum.com-2024.08.22-18_42_30.png

1724371848745.png

Some of the top end LED fixtures deliver this 2000 µmol/m2/sec
 
Last edited:
Latest posts

Latest posts

Top