What's new

DIY Organic Potting Mix's for Grass - Ace Spicoli

PH donner

Active member
Nice info!
I think you like tis too
It's in Dutch but Google translate is your friend
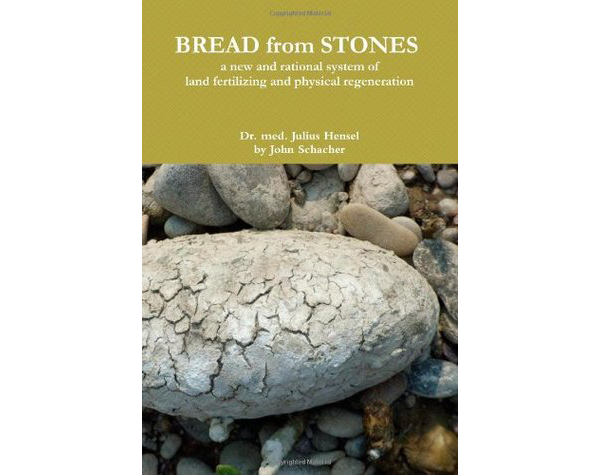
Stones give bread


English version


acespicoli

Well-known member

Testing growing media pH and EC​

A test method comparison
aHR0cHM6Ly9naWVjZG4uYmxvYi5jb3JlLndpbmRvd3MubmV0L2ZpbGV1cGxvYWRzL2ltYWdlL3BpY3R1cmUgNSAtIGUuYy4gbWVhc3VyZW1lbnQgaW4gbXVkLmpwZw.8KFUXuSIhr8.jpg

PREMIER TECH HORTICULTURE TEAM
SEPTEMBER 19, 2012
There are various ways to test growing media to know your ph and EC. This is a short review of the five different growing medium testing methods , how to prepare the growing media samples and the appropriate way to test the pH and EC of each sample.

Saturated media extract, 1:2 dilution and 1:5 dilution
Regardless of the method, when collecting growing medium for testing, take the samples from plants that are the same variety, age, container size and fertilized the same. Not following this can result in values that are inconsistent, making it difficult to interpret the test results and make adjustments to your fertilizer program, if necessary. The Saturated Media Extract (SME), 1:2 and 1:5 (parts media:parts water) require collecting growing medium from the root zone and soaking it in varying volumes of distilled water.

If the growing medium is obtained from potted plants, select six to 10 plants and remove the growing medium from the two-thirds of the outside edge of the root zone. Avoid taking the top ½ inch (1.3 centimeter) of the root ball as it contains high salts that can distort test results. For bedding plants, use the lower two-thirds of the root ball from six to 10 plants. For plugs, use the whole cell; however, try to avoid the top layer of growing medium. The goal is to obtain up to 2 cups of growing medium per sample, place it into a plastic bag and mix it together.

Next, add distilled water to the growing medium sample. The amount of water depends on the test. For the SME Method, add enough distilled water until the growing medium glistens, but no water puddles on the surface. For the 1:2 and 1:5 test methods , add one part growing medium to either 2 parts distilled water or 5 parts distilled water, respectively. Regardless of the test method, allow the sample to sit for one hour. If the pH and EC meters have probes, stick the probe in the “mud” to obtain the results. If not, squeeze water from the “mud” with a coffee filter and measure the pH and EC of the extracted solution. Samples containing controlled release fertilizer should be handled carefully to avoid breaking the prills. As a special note, the SME Method is used by the majority of horticulture laboratories. If you use this method, you can compare your pH and EC results with laboratory results.

Picture%204%20-%20Sample%20Volumes.jpg

Three growing media samples prepared using the SME, 1:2 or 1:5 testing methods. All three samples have the same amount of growing medium, but different volumes of distilled water.

Picture%205%20-%20E_C_%20measurement%20in%20mud.jpg

SME test method - measuring EC in the mud.

Picture%206%20-%20pH%20measurement%20in%20mud(2).jpg

SME test method - Measuring pH in the mud.

Pour-through and squeeze methods
These methods are non-destructive and involve extracting water from a container or cell. The pour-through method is used for cell packs and larger pots while the squeeze method is for plugs or liners smaller than a 50-count tray. Standards for both methods are not as well established, but it is better to use these testing procedures than not test at all. Both the pour-through and squeeze methods require saturating the growing medium one hour before testing. If you constant feed, use the fertilizer solution to thoroughly water the plants or if you pulse feed, use clear water.

For the pour-through method, pour distilled water over the growing medium surface, as listed in the table below, and collect the leachate that flows out of the bottom of the container. The goal is to obtain 50 milliliters (2.5 ounces) of solution per sample. Do not exceed 60 milliliters (3.0 ounces) as the sample will be too diluted and result in lower EC values.

Chart%201.jpg


For the squeeze method, collect the solution from the plug by either pressing down on the surface or removing the plug and squeezing the solution out of the growing medium. The volume of solution needed depends on the pH and EC meters used for testing.

For both the pour-through and squeeze methods, the pH and EC are taken directly from the collected solution. The pour-through method is preferred if controlled release fertilizer has been incorporated into the growing medium, since it does not break the prills. Do not use these methods for sub-irrigated crops as excessive surface salts will be leached out into the collected solution and affect EC and pH results.

The table below summarizes the interpretive values of various extraction methods:

Chart%202.jpg


The key to optimizing your plants’ performance starts with consistent, reliable substrates. HydraFiber® is a highly engineered media designed for use across a variety of plants and crops. It blends easily with other mix components and is designed to support the unique nutritional and water retention needs of your plants. Unlock total plant performance today.
* Levels are unacceptable for seedlings

Remember to calibrate your ph and EC equipment before any testing to be sure the results obtained are accurate. With these test results, you can verify if your fertilizer program is delivering the correct nutrients to your crop or you can make adjustments if needed. Please contact Premier Tech Grower Services for additional information and support.
https://www.greenhousemag.com/news/premier-tech-testing-growing-media-ph-ec/
 

acespicoli

Well-known member
1727177588455.png

1727177569402.png


What is a cation?


A cation has more protons than electrons, consequently giving it a net positive charge. For a cation to form, one or more electrons must be lost, typically pulled away by atoms with a stronger affinity for them. The number of electrons lost, and so the charge of the ion, is indicated after the chemical symbol, e.g. silver (Ag) loses one electron to become Ag+, whilst zinc (Zn) loses two electrons to become Zn2+.


The energy shift involved when an atom becomes a cation is shown.


Figure 1: The generation of a cation. Credit: Technology Networks.

What is an anion?


An anion has more electrons than protons, consequently giving it a net negative charge. For an anion to form, one or more electrons must be gained, typically pulled away from other atoms with a weaker affinity for them. The number of electrons gained, and so the charge of the ion, is indicated after the chemical symbol, e.g. chlorine (Cl) gains one electron to become Cl-, whilst oxygen (O) gains two electrons to become O2-.
1727177832944.png

Figure 2: The generation of an anion. Credit: Technology Networks.

Cation vs anion chart


The main differences between cations and anions are summarized in the table below.

CationAnion
ChargePositiveNegative
Electrode attracted toCathode (negative)Anode (positive)
Formed byMetal atomsNon-metal atoms
ExamplesSodium (Na+), Iron (Fe2+), Ammonium (NH4+)Chloride (Cl-), Bromide (Br-), Sulfate (SO42-)

Metallic atoms hold some of their electrons relatively loosely. Consequently, they tend to lose electrons and form cations. Conversely, most nonmetallic atoms attract electrons more strongly than metallic atoms, and so gain electrons to form anions. Therefore, when atoms from a metallic and a nonmetallic element combine, the nonmetallic atoms tend to draw one or more electrons away from the metallic atoms to form ions. These oppositely charged ions then attract one other to form ionic bonds and produce ionic compounds with no overall net charge. Examples include calcium chloride (CaCl2), potassium iodide (KI) and magnesium oxide (MgO).


Cation vs anion periodic table


It can be possible to predict whether an atom will form a cation or an anion based on its position on the periodic table. Halogens always form anions, alkali metals and alkaline earth metals always form cations. Most other metals form cations (e.g. iron, silver, nickel), whilst most other nonmetals typically form anions (e.g. oxygen, carbon, sulfur). However, some elements are capable of forming both cations and anions given the right conditions. One example is hydrogen, which may gain (H-) or lose (H+) an electron, forming hydride compounds such as ZnH2 (where it is an anion) and hydron compounds such as H2O (where it is a cation).


Elements in group 18 of the periodic table – the “noble gases”, tend not to form ions due to the arrangement of their electrons which makes them generally unreactive.

The periodic table.
Figure 3: The periodic table. Credit: Technology Networks
 

Attachments

  • 1727177980981.png
    1727177980981.png
    1.4 MB · Views: 2

acespicoli

Well-known member

Elemental Composition of Corn Plants​

Carbon, oxygen, and hydrogen are considered “freebie” nutrients because they do not need to be applied as fertilizer in crop production. These three nutrients comprise approximately 94% of the dry weight of the corn plant (carbon – 44%, oxygen – 45%, and hydrogen – 6%) (Figure 1) (Latshaw and Miller, 1924). Yet they are hardly ever considered in a corn fertility program. Carbon, oxygen, and hydrogen are principal components of starch, protein, oil, and fiber, which comprise about 85% of the final grain yield. (The remaining 15% is water.) What can corn producers do to increase carbon, oxygen, and hydrogen uptake? This Field Facts article discusses the sources of carbon, oxygen, and hydrogen and considers management options to increase uptake of these essential nutrients.
Elemental composition of corn plant dry weight - carbon hydrogen oxygen

Figure 1. Elemental composition of corn plant dry weight.

Sources of Carbon, Oxygen, and Hydrogen​

Carbon​

Carbon is extracted from carbon dioxide (CO2) in the atmosphere. Photosynthesis converts low-energy carbon-oxygen (C-O) bonds primarily to higher energy carbon-hydrogen (C-H) and carbon-carbon (C-C) bonds in sugars, starch, oil, amino acids, and other organic compounds. From a fertility perspective, CO2 is an unlimited resource in the atmosphere, so we do not need to fertilize corn with carbon. Carbon is and will continue to be a “freebie” nutrient.
Sources of oxygen for corn plants

Figure 2. Sources of oxygen for the corn plant. Shoots extract oxygen from the air, while roots extract oxygen from the soil atmosphere. Very little oxygen translocates between corn shoots and roots.

Oxygen​

There are three sources of oxygen (O2). The first source is molecular oxygen extracted from the air or from the soil atmosphere. Mitochondria in corn plant cells require oxygen to function properly to produce energy. Mitochondria in corn shoot cells consume oxygen extracted from the air while mitochondria in corn root cells consume oxygen extracted from the soil atmosphere. Transport of oxygen from corn shoots to corn roots is very limited and insufficient to meet root demand because water can dissolve only very low amounts of oxygen (Figure 2).
The second source is oxygen extracted from water as water molecules are split during photosynthesis (Figure 3). The vast majority of this oxygen is released into the atmosphere as molecular oxygen. However, a low percentage of oxygen molecules could be consumed by plant mitochondria to generate energy during mitochondrial respiration.
Photosynthesis converts carbon dioxide and water into sugar and oxygen

Figure 3. Photosynthesis converts carbon dioxide and water into sugar and oxygen.
The third source is oxygen contained in carbon dioxide (CO2) (Salisbury and Ross, 1978). During photosynthesis, this oxygen is incorporated into sugar, which is the starting material for all plant organic compounds. This is the oxygen that contributes to yield.

Hydrogen​

The source for essentially all hydrogen in the corn plant is hydrogen extracted from water (Figure 3). During photosynthesis, as plant cells assimilate oxygen, extracted from CO2, into sugar, these cells also assimilate hydrogen, extracted from water, into sugar. Approximately 91% of corn grain dry matter is derived from air and water..

Carbon, Oxygen, and Hydrogen Uptake​

The key to managing these essential nutrients is to manage soil water. If the soil contains too much water, mitochondria in the corn root cells suffocate from lack of oxygen and die, leading to overall root death. The soil atmosphere contains up to about 21% oxygen, whereas the solubility of oxygen in water is about 6 to 12 parts per million. Oxygen in the soil atmosphere in a well-aerated soil is about 30 times more available to the corn root than oxygen in a water-saturated soil.
If the soil contains too little water, evapotranspiration is limited, plant stomates close, and very little carbon dioxide and oxygen are captured in stomatal chambers (Figure 4). Reduced carbon dioxide levels limit the amount of carbon that is converted into sugar, and reduced oxygen levels inhibit mitochondrial respiration for energy production. Limitations of both functions reduce grain yield. When the corn plant is transpiring properly, stomates are open to allow for release of water vapor into the atmosphere. These open stomates also allow CO2 and O2 to move from the atmosphere into stomatal chambers. As stomates close to conserve water during dry conditions, these closed stomates also restrict the capture of CO2 and O2.

Managing water in the soil is like managing the oil in your tractor engine. As long as you maintain the oil level between the “full” and the “add” marks on the dipstick, oil pressure is suitable for proper engine function. For water, as long as the water content in the soil is greater than the wilting point and is at or less than field capacity, corn grows properly. Management practices to better ensure maximum corn growth and yield include:
  • Install tile drainage to more rapidly remove excess water during rainy periods.
  • Manage soil tillage to create a soil structure that allows maximum water percolation and capture during and after rains or irrigation events.
  • Improve the soil structure to allow better retention of water between rainfalls or irrigations.
  • Conserve soil moisture by maintaining surface residue to reduce evaporation of water directly from the bare soil surface.
  • Fertilize properly to allow the corn plant to efficiently capture all of the carbon it can.
  • Select hybrids that perform well in drier environments.
Stomatal guard cells - regulate exchange of materials between the atmosphere and corn plants

Figure 4. Stomatal guard cells regulate the exchange of materials between the atmosphere and the corn plant. Proper soil moisture better ensures guard cells are open to allow for maximum uptake of CO2 and other gases.

References​

  • Latshaw, W. L., and E. C. Miller. 1924. Elemental composition of the corn plant. Journal of Agricultural Research 27:845-860.
  • Salisbury, F. B. and C. W. Ross. 1978. Plant Physiology. 2nd Ed. Wadsworth Publishing Co., Belmont, CA. pp. 123-159.
 

acespicoli

Well-known member
Had previously looked this up for cannabis will find it again and list it here

Despite having different pharmacological effects, both CBD and THC share a similar chemical structure. They both contain 21 carbon atoms, 30 hydrogen atoms, and 2 oxygen atoms.

Cvh

Well-known member​

Supermod
Free ☕ 🦫

I copied it for you from the other thread I posted above


The complete plant has the following composition: C (38.94%), H (6.06%), N (1.74%), O (48.72%),ashes (4.54%).

The stalks contain: C (56.80%), H (6.48%), N (0.43%), O (34.52%), ashes (1.77%).

The leaves contain: C (40.50%), H (5.98%), N (1.82%), O (29.7%), ashes (22%).

The ashes of the hemp plant contain: KOH (7.48%), NaCO 3(0.72%), CaO (42.05%), MgO (4.88%), Al2O3(0.37%), SiO2(6.75%), H3PO4(3.22%), H2SO4(1.10%),Cl (1.53%), CO2(31.90%)

The ashes of the seeds contain: KOH (20.81%), NaCO3(0.64%), CaO (25.57%), MgO (0.96%), FeO2(0.74%), H3PO4(35.52%),CaSO
4(0.18%), NaCl (0.09%), H2SiO3(13.48%), C (6.19%)

Cheers
 
Last edited:

acespicoli

Well-known member

Balancing the Nutrient Equation​

Essential considerations for providing complete cannabis fertilization.

BRIAN WHIPKER, PAUL COCKSON, PATRICK VEAZIE, JAMES T. SMITH AND HUNTER LANDIS
JUNE 08, 2020
AdobeStock_139018825_fmt.png


How many times have we heard that a balanced diet is essential to our health? Plant nutrition isn’t much different. Cannabis plants can thrive or struggle depending on how you design your fertilization programs. Plants require 17 essential elements for growth. They obtain hydrogen (H), oxygen (O), and carbon (C) from irrigation water or as a gas via the atmosphere. Growers must provide the remaining 14 elements to help cannabis plants thrive.
These include the macroelements:
  • nitrogen (N)
  • phosphorus (P)
  • potassium (K)
  • calcium (Ca)
  • magnesium (Mg) and
  • sulfur (S).
And they also include the microelements:
  • boron (B)
  • chlorine (Cl)
  • copper (Cu)
  • iron (Fe)
  • manganese (Mn)
  • molybdenum (Mo)
  • nickel (Ni) and
  • zinc (Zn).
The quantity of macroelements and microelements required varies by type of plant, but they are all required by the plant for growth.
Cobalt (Co), selenium (Se), silicon (Si) and sodium (Na) are four beneficial elements that promote plant growth but are not considered necessary to complete the plant life cycle. With cannabis production, many growers are providing Si to promote overall plant health.
Scroll to continue with content

Providing a complete fertilizer package that contains all the essential elements is important to maximize plant growth. When designing a fertility program, it is also important to keep in mind some key principles that ensure there is a nutritional balance. Just like with human health, where we must balance our intake of sugar, protein, grains, fruits and vegetables, too much of one item can lead to imbalances in the plant due to antagonistic effects. For example, if too much P is provided, it can hinder the uptake of other elements and lead to Fe, Mn and Zn deficiencies.

Key Considerations​

Nitrogen Form. Nitrogen in fertilizers primarily comes from three sources. Nitrate-nitrogen is the main form the commercial floriculture greenhouse industry uses for its plants. While the cost is higher, it’s the preferred form of N because it promotes compact plant growth. In the cannabis industry, the market currently lacks plant growth regulators registered for use on cannabis, so you can opt for nitrate as a source for N to help avoid excessive overgrowth, also known as plant stretch.
The other two forms of N contained in most fertilizers are ammoniacal nitrogen and urea. Many organic fertilizers have N in these forms. In commercial floriculture greenhouse production, these two forms of nitrogen are strategically deployed but are only used to a limited extent. Many growers will use ammoniacal nitrogen and urea-based fertilizers during the first two weeks after plants have been transplanted into the final container to help establish the plants and encourage a flush of new growth. After that point, most growers rely upon a nitrate-nitrogen based fertilizer.
The key takeaway here is to supply most of your N from nitrate-nitrogen. Do an evaluation of your fertilizer type by reading the fertilizer label to ensure the N form you are providing is on target.
Moderating P Applications. Phosphorous fertilization strategies have been studied extensively over the past five years. One of our graduate students, Josh Henry, worked on optimizing P fertilization rates for his master’s degree thesis. In essence, plants require a baseline level of P to grow adequately (Fig. 1). For a continuous fertilization program for plants grown in a soilless substrate, the target concentration is between 8 ppm and 15 ppm of P. Providing levels below that will result in less plant growth, while concentrations above that level provide little benefit while costing more money. Phosphorus is also the primary contributor to plant stretch. Too much P will lead to excessive internode elongation and tall plants. That’s why it’s important to limit excessive P applications.
alternanthera_image_fmt.png
Figure 1: Understanding P Rates. The response of Alternanthera (pictured) to increasing concentrations of phosphorus (P) from 0, 5, 10, 20 or 40 ppm (left to right). Phosphorus concentration can be used to control excessive plant growth, but adequate levels must be provided to avoid deficiency situations.
Plant nutrition experts are currently debating whether the P rate needs to be amplified just before flowering in cannabis to improve quality. Research led by Manitoba crop nutrition specialist John Heard on a dual-purpose hemp crop grown for seed and fiber suggests that extra P is not required by cannabis (Fig. 2).
NM-chart-1_fmt.png
Figure 2: The uptake of phosphorus (P) by a dual-purpose hemp crop grown for seed and fiber. The illustration is modified from work conducted by Heard et al. in Manitoba, Canada. The gray box area represents the start of long nights and corresponding reproductive growth, which is assumed to occur with >9.5-hour night lengths in Winnipeg, Manitoba, starting around Aug. 15. Accumulation of P into the seed and during seed maturity would not apply to greenhouse-grown cannabis plants; therefore, higher levels of P should not be required. This brings into question the need to increase P applications during late flowering of greenhouse-grown cannabis crops. *Phosphorus pentoxide “Nutrient uptake and partitioning in industrial hemp.” J. Heard et al., Manitoba, Canada
The researchers found that hemp plants front-end load P during the first half of the growing season as seen with the plant’s upward accumulation of P. At midseason, the total accumulation in the plant plateaus. This indicates that the plant uptakes limited additional P. Hemp relies upon those internal P reserves and translocates (moves) P if it is required in other parts of the plant. This suggests that adequate P levels should be provided to cannabis during the first half of the production cycle for the plant to accumulate an adequate reserve that can be translocated if needed later. Providing a P boost late in the growing season appears to not be needed. There is a need to conduct a scientifically based trial to clear up this uncertainty with greenhouse-grown cannabis.
While the target level of P required by greenhouse-grown cannabis is not currently known, we would speculate based on the scientific data from other species that levels of 15 ppm to 20 ppm P supplied on a constant basis should be all that is required. At North Carolina State University we have begun an experiment looking into optimal P rates supplied at a constant level throughout the cannabis crop cycle and will be able to further refine those recommendations in the near future.
Ratio of K to Ca to Mg. Providing the proper balance of K to Ca to Mg is important for greenhouse production of cannabis. Too much of one element does not in itself result in toxicity symptoms. Instead, excessive levels of one element has an antagonism against the others. For instance, excessive K will result in either a Ca deficiency or an Mg deficiency being observed in a plant. Many instances of Mg deficiency observed in cannabis may be due to excessive K being supplied and not due to the lack of available Mg to the plant. Figure 3 illustrates the trend that is observed in the leaf tissue concentration of a plant when K is excessive.
NM-chart-2_fmt.png
Figure 3: The relationship of how increasing the concentration of K can have an antagonistic effect on both Ca and Mg uptake by a plant. A balanced fertilization approach of providing K to Ca to Mg in a 4:2:1 ratio to optimize uptake of all three nutrients is required. Illustration adapted from research conducted on poinsettias.
For cannabis, K, Ca and Mg all appear to be needed in larger quantities compared to other greenhouse floriculture species. In general, the rule is provide K, Ca and Mg in a 4:2:1 ratio to avoid antagonisms. For commercial poinsettia production, we recommend a similar ratio around 200 ppm K to 100 ppm Ca to 50 ppm Mg; this would be a good starting point for cannabis (which, like poinsettias, is a short-day plant) until scientifically based research can determine optimal rates. Also, keep in mind that excessive sodium (Na), which can come from your fertilizer source or irrigation water, can also interfere in K, Ca and Mg uptake.
Dialing in the Micros. Managing microelements can be a challenge in most fertilizer programs. The concentration difference from deficient to adequate to excessive rates is very narrow. Until you become comfortable mixing your own micronutrient fertilizer salts, it’s safer to rely upon premixed micronutrient packages or the micros provided in commercial fertilizer blends.
All in Balance. Providing all the essential elements is the key to optimizing plant growth. Equally important is balancing the proportion of elements provided to cannabis so plants remain healthy.
 

acespicoli

Well-known member
For cannabis, K, Ca and Mg all appear to be needed in larger quantities compared to other greenhouse floriculture species. In general, the rule is provide K, Ca and Mg in a 4:2:1 ratio to avoid antagonisms.

Interesting detail from the article above,
 

acespicoli

Well-known member

Understanding the Transition to LED​


by LightsADMIN June 20, 2021
COMMERCIAL CANNABIS, CULTIVATION, OTHER

led grow lights for indoor plants

Do LEDs Actually Impact the Calcium-Magnesium Levels in Cannabis?

When converting from HPS or HID lighting to LEDs, some growers have reported a difference in the way that their cannabis absorbs inputs, specifically Calcium and Magnesium. This has created an ongoing debate about nutrients and lights and a bit of controversy about LED lighting.
LEDs have been shown to help increase yields, productivity, and the overall health of the cannabis plant. However, they are most effective when the entire growing environment is in line including regular monitoring of the VPD levels so that your plant has the ideal leaf temperature and humidity levels to absorb those vital nutrients.

SO, DO LEDS IMPACT THE CALCIUM-MAGNESIUM NEEDS?

This is a common question among growers, however, the answer is not a simple one.
LEDs have a direct impact on your plant’s growing environment. To expand your understanding a bit further, it helps to explore how switching to LEDs will alter the temperature and humidity of your space.
One of the biggest differences between LED lights and HPS lights is that LEDs do not emit infra-red waves. In most cases, the fact that LEDs do not emit large amounts of heat is extremely positive. This feature alone will have a direct impact on the overall energy load of your facility and make it easier to have a consistent environment.
Alternatively, infra-red lights heat up the plant and growing medium. The heat these lights give off change other aspects of the environment, including the temperature and humidity. They essentially act as both a light and a heat element, so when making the switch to LED you need to take into account that that heat source is now removed. This includes making an adjustment to the Vapour Pressure Deficit (VPD) to create the ideal growing environment for your cannabis plants.

WHAT DOES THIS HAVE TO DO WITH NUTRIENTS?

Often times when growers switch out their lights, they notice that their plants are reacting differently to the inputs. Suddenly, the same level of nutrients that were added when the grower was using HPS lights is now either burning your plants or causing nutrient deficiencies resulting in slow growth.
Although it’s easy to blame it on the LEDs, the story is a bit more complicated than that.
In fact, most cultivars will not require any changes to their nutrient regime, as long as all other environmental factors are in the proper ranges.
This is because the environment plays a major role in how your plants uptake the nutrients. If growers are looking to maintain the same nutrient schedule that they had before they converted to LEDs, then, they need to recreate the previous environment, especially VPD.
Understanding VPD is critical as it provides insight into how water interacts with your crops-both in the air and within the substrate. Including measuring the leaf surface temperature, not just the room air temperature. This information will also give you a deeper understanding of how a healthy plant controls its water and nutrient uptake.
On a positive note, if we keep the temperature of the biomass of the plants, as well as the relative humidity, in the proper range, then the VPD will be correct. The plants will essentially exhale the ideal amount of water vapour from their leaves and in turn uptake the ideal amount of water and nutrients from their roots.
So, once you recreate that ideal range, you can most likely maintain the same nutrient schedule as before.

The BENEFIT OF LED

The key message here is that we need to make sure that crops are grown under the most ideal conditions possible- no matter your light source. One of the benefits of LEDs is that they help increase the photosynthetic activity of the plant, including providing a more chlorophyll-targeted spectrum. The benefits of this targeted spectrum includes higher yields, consistent plant size, and larger buds.
However, in some varieties, this may also mean that the plants need a bit more nutrients to keep up.
There always will be some cultivars that will require more calcium and/or magnesium when growing them under LED as compared to other light sources. So pay attention to how your plant responds to the new growing environment, check the VPD, and make adjustments (including less or more inputs) as needed.
 

acespicoli

Well-known member

Color in Minerals
l8sj49.gif

Quick Links:

How do we perceive color?​

  • color perceived depends on the light the object is viewed under: the effect of illumination type can be very important (fluorescent vs. incandescent light)
  • human vision
    • rods: low intensity light -> one color perceived (gray)
    • cones: three pigment types RGB, thus color is seen = %r + %g +%b
    • eyes most sensitive to green light.
How do we perceive color?
Electromagnetic spectrum
Why do things look colored?
Physical processes
Causes of color

Electromagnetic spectrum:​

  • We see radiation with wavelengths in the "visible" spectrum
    Visible spectrum: Red, Orange, Yellow, Green, Blue, Indigo, Violet.
l7s4.jpeg

Why do things look colored?​

  • thing are colored when some process removes some wavelengths (absorbs specific wavelengths) from the visible spectrum
  • Question: blue sapphire viewed in candle looks black, why ?
    • Blue sapphire is blue because this is the only wavelength range of visible light that can be transmitted by the stone. Candle light is rich in red wavelengths and poor in blue wavelengths. Thus, the wavelengths (colors) of visible light available are exactly those that can NOT be transmitted. Result: no light is transmitted, the stone appears black!

  • If you understand this, then you understand some of the important basic concepts in this module!

Physical processes occurring in the stone:​

An electron transition requires a specific amount of energy, and can only use light with a specific wavelength (each wavelength having a corresponding energy).
Let's _define_ adsorbtion here?
  • luminescence: electron returns to its ground state (where it started) and releases the amount of energy it absorbed (thus returns light with that wavelength to the spectrum, thus, no color....
However, if energy is dissipated in other ways, we see the color of the light that was NOT adsorbed, e.g., if adsorb red and orange light and the energy of these wavelengths is lost (e.g., as heat), see Y+G+B+I+V (green-blue).
  • fluorescence: If some of the adsorbed energy is lost but the reminder is returned to the visible spectrum, the light returned has lower energy and thus, different color. [changes in energy = changes in wavelength = changes in color].
absorption of energy....View this movie!

Click for larger image!

Causes of color in minerals

dispersed metal ions
charge transfer
color centers
band theory (not required for EPS2)
physical optics (covered later)

Impurities cause color in gems!​

Impuritiesare elements (e.g., Ti, V, Cr, Mn, Fe, Co, Ni, Cu...) that are not present in the pure compound. Impurities are elements that occur in low concentration in the gemstone.
Example:
A ruby may contain < 1% Cr and it will look pink or red, but the same material without Cr will be completely colorless. This example contrasts with gems such as turqoise, in which the color-causing impurity is a major ingredient.
If we take one mineral, beryl, and add different impurities, we get different colors:
Beryl containing iron (Fe):
  • Aquamarine = Fe++, beryl is blue
  • Heliodor = Fe+++, yellow
  • Green beryl : due to mixtures of Fe2+ and Fe3+
Beryl containing Manganese(Mn):
  • Morganite : Mn++ is pink
  • Red beryl : Mn+++ is red
Beryl containing Chromium(Cr):
From the above examples it is clear that the oxidation state(e.g., Fe2+ vs. Fe3+) also affects the color!
If impurity ions produce color, the color can be changed if the oxidation state can be changed.
Note: heating beryl that is green or yellow reduces ferric iron, and the beryl turns blue. This greatly increases the stone's value.
The process of color change can simply involve heating the stone in a low oxygen atmosphere. This could be done by wrapping the stone in paper and allowing the paper to burn
Mn+++ is efficient at absorbing light, (blue end of the spectrum) thus color is strong.

The same impurity colors different gems differently!

Example:
Chromium (Cr+++) in ruby: red
Chromium (Cr+++) in beryl: emerald green
Chromium(Cr+++) in alexandrite: purplish or red (see below!)
This effect is because the Cr absorbs light differently when it is in beryl, emerald, and alexandrite. This is illustrated here for ruby, alexandrite and emerald
Note the different regions of absorption and transmission in the above diagram.
In the case of ruby, the largest valley (transmission window = low in the absorption graph) occurs at the red end of the spectrum, thus the stone essentially looks red. (However, a smaller transmission window may occur at blue wavelengths (as shown). This gives a purplish cast to the red color of ruby).
In the case of emerald, most tramsmission occurs at green wavelengths and most other wavelengths are absorbed strongly. Thus, emerald looks green.
l9s16.jpeg
The "Alexandrite" color change effect:
an example where the details are important! Color change due to change in the color of incident light! (recall that fluorescent light is bluish (rich in blue wavelengths) and candle light is rich in red and orange wavelenghts).
Alexandrite is the best known example of a gemstone that changes color depending upon the light it is viewed under.
In the case of alexandrite, there are two approximately equal sized tranmission windows - the first at blue and second at red wavelengths. When viewed in light made up of all wavelenghts, the stone tramsmits blue and red and often looks purple or purple-grey.
Here is a diagram showing the:
case of illumination of alexandrite with regular (white) light
When viewed in light containing mostly red wavelengths (e.g., candle light) the stone looks red. This is understood because, although the stone could transmit blue light, there is no blue light to transmit.
Here is a diagram showing illumination of alexandrite by reddish light
The reverse is also true. In light rich in blue wavelengths (e.g., fluorescent light), the stone looks blue because, although it could also transmit red, there is little red in the light to transmit.
Here is a diagram showing illumination of alexandrite by light rich in blue wavelenghts. Different specimens of the same gem will be characterized by slightly different adsorption/transmission characteristics (different adsorption spectra shapes) and so their colors will vary!
Note: this color change effect in response to change in illumination type (e.g., incandescent vs. fluorescent) is not restricted to alexandrite! Many gems have color change varieties, e.g., sapphire, garnet.

In all cases the explanation for color change is the same, involving the range of wavelengths in the light and the ability of the stone to transmit two different ranges of wavelengths of light (e.g., red and green). Other examples.
Visit a spectroscopy site with many additional examples of color caused by impurities!
Tl7al.jpeg


alex2.jpeg


alex3.jpeg

Charge Transfer causes color in gems.​

Charge transfer can only occur in compounds that have at least two elements in different and variable oxidation states. Charge transfer can produce very intense colors in gems and minerals.
The term charge transfer refers to the process where electrons are swapped between elements. Examples of elements that can participate in charge transfer are:
    • Fe2+ and Fe3+
    • Ti3+ and Ti4+
    • Mn2+ and Mn3+ and Mn4+ etc.
    Furthermore, a crystal can contain mixtures of these elements (e.g,. Mn and Fe) and these can participate in charge transfer.
    Energy is absorbed from visible light to transfer electrons from one atom to another.
For example:
  • A crystal contains metals (M) in two oxidation states: M2+ and M4+
  • M2+ can loose an electron and become M3+
  • M4+ can accept the electron (from above) and become M3+.
  • Thus, the crystal can exist with
  • M3+ plus M3+ or M2+ plus M4+.
    As you can see, these pairs are interchangeable by movement of an electron.
    This is described more fully as intervalence charge transfer!
More examples:
  • cation - cation
    • Tl7sap.jpeg
      sapphire: Fe++ <-> Ti4+ , requires red light therefore...Deep blue of sapphire
    • in beryl, Fe++ and Fe+++ exchange of electron (charge transfer): requires energy = red light, therefore you'll see...aquamarine ; with more Fe+++ -> greener color due to absorption
    • In tourmaline, Mn++ <-> Ti 4+, and the result is a yellow-green color
  • anion - anion
    • Tl6sj75.jpeg
      Lazurite (in lapis lazuli) involves charge transfer between a triangle of sulfur atoms
  • cation - anion :
Visit a spectroscopy site with additional information about color caused by charge transfer.
l7s9.jpeg

Color centers​

Color centers are imperfections in crystals that cause color (defects that cause color by absorption of light).
They are most often due to radiation damage: e.g., damage due to exposure to gamma rays. This irradiation may be from both natural (U, Th, K in minerals) or artificial sources. In rare cases, UV light can produce color centers.
If damaged by radioactive decay, electrons can be removed from their normal sites, bounce around, loose energy, and eventually come to rest in a vacant site in the structure (a trap).
One crystal may have many different types of electron traps
Electrons in specific traps absorb only a certain range of wavelengths, color that is seen is the color not absorbed by these trapped electrons.
Examples:
Because they are a form of damage, color centers can be removed by addition of energy. This may involve heating the stone to a few 100 C.
Example: Heat treat brown zircon, it may turn blue!! (this is a common gem treatment!)
  • In some cases, exposure to sunlight (especially UV) provides sufficient energy to remove the color center! - amethyst is an example.
Review: when electrons escape their traps, color centers are removed, so color is removed.
  • Because irradiated minerals may have several color centers (several traps with different energies required to allow electrons to escape, color can be manipulated by selective removal of unwanted color centers (controlled heating).
We will revisit this topic when we discuss topaz, for example!
Visit a spectroscopy site with additional examples of color caused by radiation damage.

Other causes of color in minerals​


Important for EPS2 students: Further explanation of basic concepts.

Previous Lecture: Diamonds and Diamond Simulants

Next Lecture: Corundum


OTHER TOOLS
Index
Mineral Reference
Glossary
 

acespicoli

Well-known member
More examples:
  • cation - cation
    • Tl7sap.jpeg
      sapphire: Fe++ <-> Ti4+ , requires red light therefore...Deep blue of sapphire
    • in beryl, Fe++ and Fe+++ exchange of electron (charge transfer): requires energy = red light, therefore you'll see...aquamarine ; with more Fe+++ -> greener color due to absorption
    • In tourmaline, Mn++ <-> Ti 4+, and the result is a yellow-green color
  • anion - anion
    • Tl6sj75.jpeg
      Lazurite (in lapis lazuli) involves charge transfer between a triangle of sulfur atoms
  • cation - anion :
Visit a spectroscopy site with additional information about color caused by charge transfer.


1727182317423.png


acespicoli

Well-known member
1727182576915.png

This graphic looks at the colours of transition metal ions when they are in aqueous solution (in water), and also looks at the reason why we see coloured compounds and complexes for transition metals. This helps explain, for example, why rust (iron oxide) is an orange colour, and why the Statue of Liberty, made of copper, is no longer the shiny, metallic orange of copper, but a pale green colour given by the compound copper carbonate.

In order to explain why transition metals are coloured, we first have to talk a little about how the electrons in an atom are arranged around the central nucleus. In secondary school, the majority of students learn that electrons are arranged in ‘shells’ around the nucleus; whilst this is a useful model for looking at electron arrangements, there is also an extra layer of complexity.

Within shells, electrons are actually arranged in special areas in particular energy levels, in sub-shells called ‘orbitals’. These orbitals come in different shapes, and are named using different letters: s, p, d, & f. Each of this orbitals can hold varying numbers of electrons: s can hold 2, p 6, d 10 and f 14. Transition metals are unique in the Periodic Table in that they are the only elements that contain partially filled d orbitals, and these are key to the coloured compounds and complexes they form.

Transition metal complexes are formed when transition metals are bonded to one or more neutral or negatively charged non-metal species, referred to as ‘ligands’. Without these bonds, all the d orbitals are equal in energy – however, once they are present, some d orbitals move to a higher energy than they were at before, whilst some move to a lower energy, creating an energy gap. This is due to the fact that, due to their differing shapes, some d orbital are nearer to the ligands than others. Electrons can move from the lower energy d orbitals to the higher energy d orbitals by absorbing a photon of light; the wavelength of the absorbed light depends on the size of the energy gap. Any unabsorbed wavelengths of light pass through unabsorbed, and this causes the coloured appearance of the compounds.

The colour can be affected by several variables. Different transition metals will exhibit different colours; as shown in the graphic above, different charges on the same transition metal can also accomplish this. The ligand also has an effect, and the same charge metal ion can be differently coloured depending on the ligands that are bound to it.
 

acespicoli

Well-known member
screenshot-en_wikipedia_org-2024_09_24-10_16_40.png

In chemistry, pH (/piːˈeɪtʃ/ pee-AYCH), also referred to as acidity or basicity, historically denotes "potential of hydrogen" (or "power of hydrogen").[1] It is a logarithmic scale used to specify the acidity or basicity of aqueous solutions. Acidic solutions (solutions with higher concentrations of hydrogen (H+) ions) are measured to have lower pH values than basic or alkaline solutions.

hydrochloric acid is a part of the acid secreted to help hydrolyze proteins and polysaccharides,

Mineral acids (inorganic acids)​


Mineral acid


From Wikipedia, the free encyclopedia

A mineral acid (or inorganic acid) is an acid derived from one or more inorganic compounds, as opposed to organic acids which are acidic, organic compounds. All mineral acids form hydrogen ions and the conjugate base when dissolved in water.

Characteristics​

[edit]
Commonly used mineral acids are sulfuric acid (H2SO4), hydrochloric acid (HCl) and nitric acid (HNO3); these are also known as bench acids.[1]
 
Last edited:

Latest posts

Latest posts

Top