What's new
  • As of today ICMag has his own Discord server. In this Discord server you can chat, talk with eachother, listen to music, share stories and pictures...and much more. Join now and let's grow together! Join ICMag Discord here! More details in this thread here: here.

Sire Lines & "Y" They Matter

acespicoli

Well-known member

A combined genetic and physical map reveals​

that genes and recombination events are concentrated near chromosome ends​

screenshot-www_ncbi_nlm_nih_gov-2024_09_17-19_29_51.png

Genome Res. 2019 Jan; 29(1): 146–156.
doi: 10.1101/gr.242594.118
PMCID: PMC6314170
PMID: 30409771

A physical and genetic map of Cannabis sativa identifies extensive rearrangements at the THC/CBD acid synthase loci​


1726616017172.png

Comparison of scaffolds between PK and FN assemblies. Alignments of scaffolds from PK and FN FALCON assemblies containing key cannabinoid biosynthesis enzymes are shown. Locations of exons are indicated by pink and blue lines for FN and PK, respectively. Repeat classes given are from RepeatModeler. Individual repeat types indicated were identified by manual analysis. Features of genes are further described and compared beneath the alignments. (A) Aromatic prenyltransferase (AP). (B) THCAS and CBDAS. (C) Olivetol synthase (OLS, or tetraketide synthase).

no equivalent of THCAS (deactivated or not) is found in hemp.

Due to the relatively high rate of polymorphism in cannabis, it should be possible to employ resequencing (e.g., low-coverage short-read Illumina protocols) either on crosses or at a population level to associate variants or variation with traits and genes, using the genetic map.

The scaffold containing CBDAS is located within a much larger repeat-rich and gene-poor region of ∼39 Mb in the central section of Chromosome 6, encompassing 151 scaffolds with no recombination in either parent observed among the 99 F1s (Fig. 1B). The scaffold containing THCAS was separated from this region in a single recombination event among the 99 crosses, thus placing it at one end of this region and indicating that the THCAS and CBDAS scaffolds are at separate loci. We suggest that this repeat-rich segment of the chromosome may have hosted a series of tandem duplications and rearrangements amplifying an ancestral gene, leading to the present chromosomal organization; there is also a pseudogene with 89%–93% identity to each of THCAS, CBDAS, and CBCAS in this region. We note that this observation represents a modification of both previous models of CBDAS and THCAS arrangement: They are not isoforms at an otherwise equivalent locus, and no equivalent of THCAS (deactivated or not) is found in hemp.
 
Last edited:

acespicoli

Well-known member

Thats a good read :huggg: thanks for sharing
ABSTRACT

Four crosses were made between inbred Cannabis sativa plants with pure cannabidiol (CBD) and pure
-9-tetrahydrocannabinol (THC) chemotypes. All the plants belonging to the F1’s were analyzed by gas
chromatography for cannabinoid composition and constantly found to have a mixed CBD-THC chemotype.

Ten individual F1 plants were self-fertilized, and 10 inbred F2 offspring were collected and analyzed. In
all cases, a segregation of the three chemotypes (pure CBD, mixed CBD-THC, and pure THC) fitting a
1:2:1 proportion was observed.

The CBD/THC ratio was found to be significantly progeny specific and
transmitted from each F1 to the F2’s derived from it. A model involving one locus, B, with two alleles, BD
and BT, is proposed, with the two alleles being codominant.

The mixed chemotypes are interpreted as
due to the genotype BD/BT at the B locus, while the pure-chemotype plants are due to homozygosity at
the B locus (either BD/BD or BT/BT).

It is suggested that such codominance is due to the codification by
the two alleles for different isoforms of the same synthase, having different specificity for the conversion
of the common precursor cannabigerol into CBD or THC, respectively. The F2 segregating groups were

used in a bulk segregant analysis of the pooled DNAs for screening RAPD primers; three chemotype-
associated markers are described, one of which has been transformed in a sequence-characterized amplified

region (SCAR) marker and shows tight linkage to the chemotype and codominance.
 

acespicoli

Well-known member
Four crosses were made between inbred Cannabis sativa plants with pure cannabidiol (CBD) and pure -9-tetrahydrocannabinol (THC) chemotypes.

All the plants belonging to the F1’s were analyzed by gas chromatography for cannabinoid composition and constantly found to have a mixed CBD-THC chemotype.
screenshot-drive_google_com-2024_09_17-21_16_27.png

@Dime this drives it home, home run

@Hammerhead was just mentioning why the potency of cannabis has deteriorated over the years
I remember once in a while and im not talking about all the time we would get some killer weed.
No CBD and it was a magic carpet ride :bigeye:
screenshot-drive_google_com-2024_09_17-21_03_51.png

screenshot-en_seedfinder_eu-2024_09_12-08_17_35.png

screenshot-drive_google_com-2024_09_17-21_23_02.png

If I recount the best in the past 35 years theres like 1/2 doz that were special
Were taking out of tons...everyday every year... year after year

Thats saying something ?

screenshot-drive_google_com-2024_09_17-21_11_49.png

The Kerala is overdue...
ah well such is life Best>>> :huggg:
 
Last edited:

acespicoli

Well-known member
1726695072684.png

Phytocannabinoids, synthases, genotypes and chemotypes of Cannabis. Phytocannabinoids are synthesised via a multi-step pathway involving different enzymes. The precursor cannabigerolic acid (CBGA) is first synthesised by a prenyltransferase from the precursor molecules geranyl pyrophosphate (GPP) and olivetolic acid (OA). CBGA is metabolised into tetrahydrocannabinolic acid (THCA) via THCA synthase, into cannabidiolic acid (CBDA) via CBDA synthase or cannabichromenic acid (CBCA) via CBCA synthase. The different synthases are encoded by the BT (encoding for an active THCA synthase) and BD (encoding for an active CBDA synthase) loci. BT/BT plants produce mainly THCA (chemotype I), while BD/BD plants produce predominantly CBDA (chemotype III). Presence of BT and BD results in chemotype II (THCA and CBDA intermediate). B0indicates that only non-functional THCA and CBDA synthases are present, which results in the accumulation of CBGA (chemotype IV). Cannabis varieties with very low overall levels of cannabinoids are categorized chemotype V, which is caused by a homozygous recessive allele of locus O. To complicate matters further, there is also a locus C, which is encoding for CBCA synthase. However, in almost all varieties, CBCA is only produced in young immature flowers. Chemotypes I and II can be considered marijuana, while the other low-THC chemotypes can be considered hemp varieties of Cannabis.
1726695102370.png

5. The battle of the sexes: Sex determination in Cannabis
5.1. The genetics of sex determination
The dioecy of Cannabis is genetically controlled (Figure 2). Hemp is diploid (2n = 20), with nine pairs of
autosomes and one pair of sex chromosomes. Female plants are homogametic with XX chromosomes and male
plants are heterogametic with an XY sex chromosome pair (Moliterni et al., 2004). Cannabis thus represents
a rare case among the flowering plants in which sex chromosomes have been identified (Charlesworth, 2016).
The diploid genome size of female Cannabis plants is estimated to be 1636 Mbp, that of a male plant 1683
Mbp by flow cytometry (Sakamoto et al., 1998). The sex chromosomes of Cannabis are the largest in the
chromosomal complement, they are estimated to comprise 6.5 % (Y chromosome) and 6.1 % (X chromosome)
13

Posted on Authorea 29 Sep 2020 | The copyright holder is the author/funder. All rights reserved. No reuse without permission. | https://doi.org/10.22541/au.160139712.25104053

Chemotypes I and II can be considered marijuana, while the other low-THC chemotypes can be considered hemp varieties of Cannabis. (Or hay ? @Tom Hill )
 

acespicoli

Well-known member
1726696498997.png

ORIGINAL RESEARCH article​

Front. Plant Sci., 30 June 2021
Sec. Plant Metabolism and Chemodiversity
Volume 12 - 2021 | https://doi.org/10.3389/fpls.2021.699530
This article is part of the Research TopicBehind the Smoke and Mirrors: Reflections on Improving Cannabis Production and Investigating Medical PotentialView all 16 articles

Identification of Chemotypic Markers in Three Chemotype Categories of Cannabis Using Secondary Metabolites Profiled in Inflorescences, Leaves, Stem Bark, and Roots​


Front. Plant Sci., 30 September 2019
Sec. Plant Metabolism and Chemodiversity
Volume 10 - 2019 | https://doi.org/10.3389/fpls.2019.01166
This article is part of the Research TopicThe Origin of Plant Chemodiversity - Conceptual and Empirical InsightsView all 24 articles

Terpene Synthases as Metabolic Gatekeepers​

in the Evolution of Plant Terpenoid Chemical Diversity​


Knowledge of terpenoid-metabolic genes, enzymes, and pathways will increasingly enable the investigation of terpenoid physiological functions in planta and under various environmental conditions. To this end, gene editing and transformation techniques applicable to a broader range of model and non-model species that produce species-specific blends of bioactive terpenoids will be critical (Wurtzel and Kutchan, 2016). Together, advanced genomic and biochemical tools and a deeper understanding of terpenoid biosynthesis and function have tremendous potential for harnessing the natural diversity of plant terpenoids for, for example, improving crop resistance and other quality traits and developing advanced protein and pathway engineering strategies for producing known and novel bioproducts.

1726696828290.png
 

acespicoli

Well-known member
1726697124421.png

1726696965623.png

Figure 4. Flowering and sex determination metabolic pathways: identification of candidate genes underneath the QTLs. The QTLs for flowering time are found in different flowering dependent pathways (photoperiod, temperature, and endogenous flowering pathways). Photoperiod pathway involves genes of the perception and transduction of light signals [ultraviolet-B receptors (uvr8), circadian timekeeper (xap5), suppressor of PHYA-105 (spa1), cryptochromes (cry1), phytochrome A (phyA), and phytochrome E (phyE)]. Temperature pathway involves vrn1, a vernalization dependent transcription factor. Both photoperiod and temperature pathways activate signaling pathways and/or transcription factors involved in the endogenous flowering pathway to regulate floral meristem identity genes, such as leafy (lfy). Genes that code for these transcription factors include flowering locus C (FLC), flowering locus D (FLD), flowering locus T (FLORIGEN or FT), suppressor of overexpression of constans1 (soc1), and gibberellic acid insensitive (gai gene – DELLA protein), among others. TF is used to summarize all transcription factors inducing floral meristem identity genes. Endogenous pathway also include the regulatory element of flowering genes, miR156. The QTLs for sex determination are found in metabolic pathways involved in regulation of phytohormones gibberellic acid (GA) or auxins. These pathways include B-class homeotic genes involved in the development of male flower organs and auxin response factors genes (ARFs) involved in female flower development.


Front. Plant Sci., 03 November 2020
Sec. Plant Breeding
Volume 11 - 2020 | https://doi.org/10.3389/fpls.2020.569958

Conclusion​

The results of this study prescribe new prospects to understand the genetics basis of flowering time and sex determination in hemp. Molecular SNP markers and QTLs were identified for these quantitative traits. Genes involved in the photoperiod and temperature flowering pathways, such as genes involved in the perception and transduction of environmental signals (i.e., light), and genes involved in the autonomous and phytohormones flowering pathways, such as flowering transcription factors, were identified in QTLs for flowering time. About sex determination, genes involved in regulating the balance of phytohormones gibberellic acid (GA) and auxins were identified. The alleles with positive effects of these sex QTLs were found to promote monecious phenotypes. Finally, the SNP markers composing the QTLs can be used to develop new hemp cultivars with early or late flowering time behaviors and to select for monecious plants. SNP markers associated with sex determination will increase the stability of monoecy determination in monecious hemp cultivars.
 

acespicoli

Well-known member
1726697704125.png

Hierarchical clustering of 40 genes involved in the isoprenoid pathway and 795 genes from other pathways. Clustering is depicted as a heatmap, in which red and green represent high and low expression values, respectively. Rows depict genes and columns depict hybridizations. Positions of the genes from the MEV pathway (m) and the plastoquinone and phytosterol pathways (+) are indicated in the left-hand column of the heatmap axis on the right side of the figure. Positions of the genes from the MEP pathway (n) and the plastoquinone, carotenoid and chlorophyll pathways (+) are indicated in the right column of the axis.

Wille, A., Zimmermann, P., Vranová, E. et al. Sparse graphical Gaussian modeling of the isoprenoid gene network in Arabidopsis thaliana. Genome Biol 5, R92 (2004). https://doi.org/10.1186/gb-2004-5-11-r92

ORIGINAL RESEARCH article​

Front. Plant Sci., 30 June 2021
Sec. Plant Metabolism and Chemodiversity
Volume 12 - 2021 | https://doi.org/10.3389/fpls.2021.699530
This article is part of the Research TopicBehind the Smoke and Mirrors: Reflections on Improving Cannabis Production and Investigating Medical PotentialView all 16 articles

Identification of Chemotypic Markers in Three Chemotype Categories of Cannabis Using Secondary Metabolites Profiled in Inflorescences, Leaves, Stem Bark, and Roots​

 
Last edited:

acespicoli

Well-known member
1726703378336.png

Cannabinoids and Terpenes: How Production of Photo-Protectants Can Be Manipulated to Enhance Cannabis sativa L. Phytochemistry.​

Desaulniers Brousseau V 1,
Wu BS 1,
MacPherson S 1,
Morello V 1,
Lefsrud M 1

Author information​

Frontiers in Plant Science, 31 May 2021, 12:620021
https://doi.org/10.3389/fpls.2021.620021
1726703473848.png


acespicoli

Well-known member

Terpene Groups as Strain Characteristics​

15 March 2023
Alexis St-Gelais, chimiste – Popularization & Plant profiles
The intensive breeding of cannabis produces strains that have different molecular signatures, and this is quite apparent within terpenes profile. These features can be useful to characterize a strain or extract, by putting forward what sets it apart from another variety. Based on our extensive experience with cannabis terpenes, let us have a look at some interesting molecular trends in the plant.

Chemotypes and Cannabis​

The production of molecules within the plant obeys a metabolic logic. A crude parallel can be made with the color of eyes in humans: depending on the genetic characteristics of an individual, our body will have the ability to produce (or not) pigments that will in turn determine the iris’ shade. The latter (although with multiple subtleties) can then be classified into a limited number of categories, like blue eyes. When studying plants, the concept of chemotype can be used to designate this phenomenon where molecules are expressed in some individuals and not (or less) in others. Polatoglu suggested the following definition for this concept: organisms categorized under same species […] having differences in quantity and quality of their component(s) in their whole chemical fingerprint that is related to genetic or genetic expression differences [1].
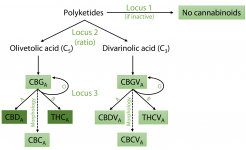
Within cannabis, cannabinoids tend to follow a chemotypical pattern, where one or two dominant cannabinoids are found but can vary from one strain to another. In The Handbook of Cannabis, de Meijer proposes a model with three genetic and one morphological turning points that can lead a given strain to express one of nine possible chemotypes (or even more, considering that one can have a mixed chemotype where two molecules are co-dominant, most typically THCA and CBDA) [2]. The model is summarized in figure 1 below, where the term “locus” refers to a zone in a chromosome of the cannabis plant where the genes encountered will influence the metabolic expression of cannabinoids.
Figure-cannabinos-biosynthesis.jpg

Figure 1.
https://en.wikipedia.org/wiki/Divarinolic_acid


1726706767389.png


PY - 2020/02/24
T1 - Secondary Metabolites Profiled in Cannabis Inflorescences, Leaves, Stem Barks, and Roots for Medicinal Purposes
DO - 10.1038/s41598-020-60172-6
Figure 1. Genetic model proposed by de Meijer [2] (figure adapted by PhytoChemia) to explain cannabinoids chemotypes. A first locus controls the expression of enzymes which are necessary for the synthesis of metabolic precursors of the phenolic part of cannabinoids – if this locus is inactive, the plant will be short of raw metabolic material and no cannabinoids will be produced whatsoever. A second locus controls the length of the carbon chain attached to this phenolic backbone, defining a proportion between C3 and C5 phenolic acids (divarinolic acid vs olivetolic acid, the latter being the precursor of the familiar THCA and CBDA). A third locus works in a similar fashion to the A/B/AB/O blood types in humans (this parallel is ours, not de Meijer’s). If the locus is inactive (akin to type O), the metabolism stops at CBGA (or CBGVA); if the genetic information for type A is present, then THCA will be produced, whereas type B will lead to CBDA (and both types can be present, as with blood type AB, for a mixed chemotype). A fourth parameter can come into play and has to do with the morphology of the trichomes, which can in some case lead to the conversion of CBGA to CBCA and give more chemotypes.
As far as we are aware, a comprehensive model for cannabis terpenes has yet to be proposed (let us know if you know of one!). You can nevertheless see from the example of cannabinoids that genetic traits in a strain can define whether or not a given molecule will accumulate as an outcome of the plant’s metabolism – or in other terms, if the strain will pertain to a given chemotype.

Correlated Terpenes​

Very often, a given metabolic transformation will be driven by an enzyme, i.e., a protein that is able to facilitate a specific chemical transformation. Enzymes can be more or less selective in what type of molecules they can transform. When several molecules are similar in structure, they can sometimes all be transformed by the same enzyme, although not necessarily all with the same efficiency or speed. This implies that if the plant expresses a given enzyme thanks to its genetic traits, not only one, but several molecules can sometimes arise. In other cases, if one transformation of a key molecule is permitted upstream, several other transformations downstream become possible since the “raw material” has been made available. In any case, even without knowledge of the exact genetic and metabolic mechanisms at play, one can therefore examine if there are correlations between molecules, which would imply that they have a common origin. If that is the case, they should be considered together, because it is unlikely that only one of them will be found.
There are several such cases in cannabis terpenes. Here are quantitatively important groups to consider:
  • • Pinenes correlate, with varying proportions of α- and β- isomers;
  • • When limonene is abundant, a series of oxygenated monoterpenes tends to also increase in content;
  • • A large proportion of terpinolene will be accompanied by the presence of several other monoterpenes;
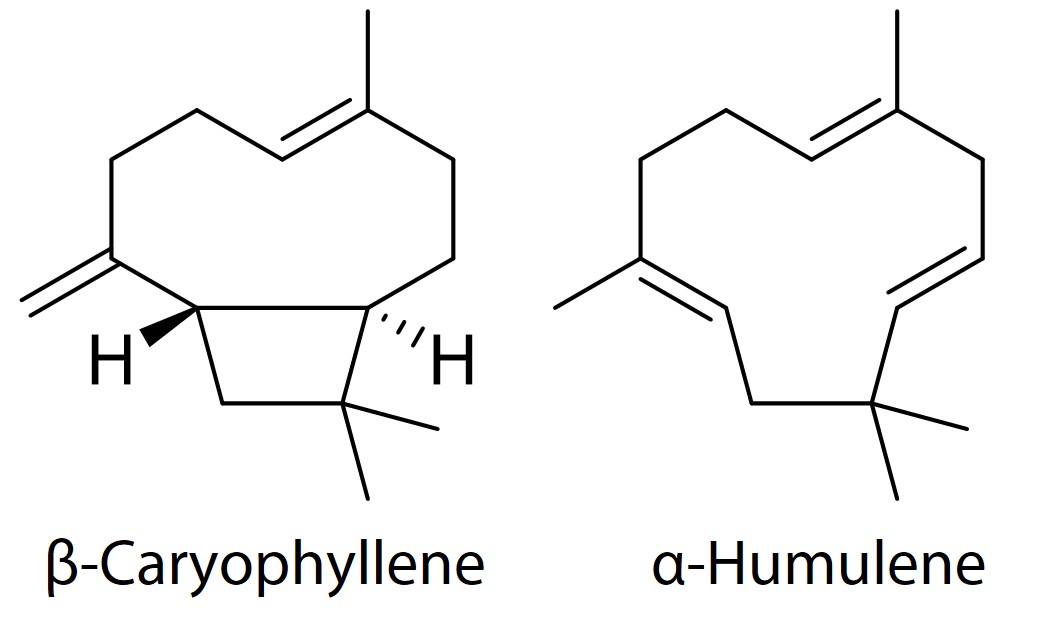
  • • β-caryophyllene and α-humulene are strongly correlated;
  • • A group of eudesmane-type (or selinane) sesquiterpenes are closely tied. Those include α- and β-selinenes, a few selinadiene isomers and juniper camphor. They also correlate with spirovetiva-1(10),7(11)-diene and eremophila-1(10),7(11)-diene;
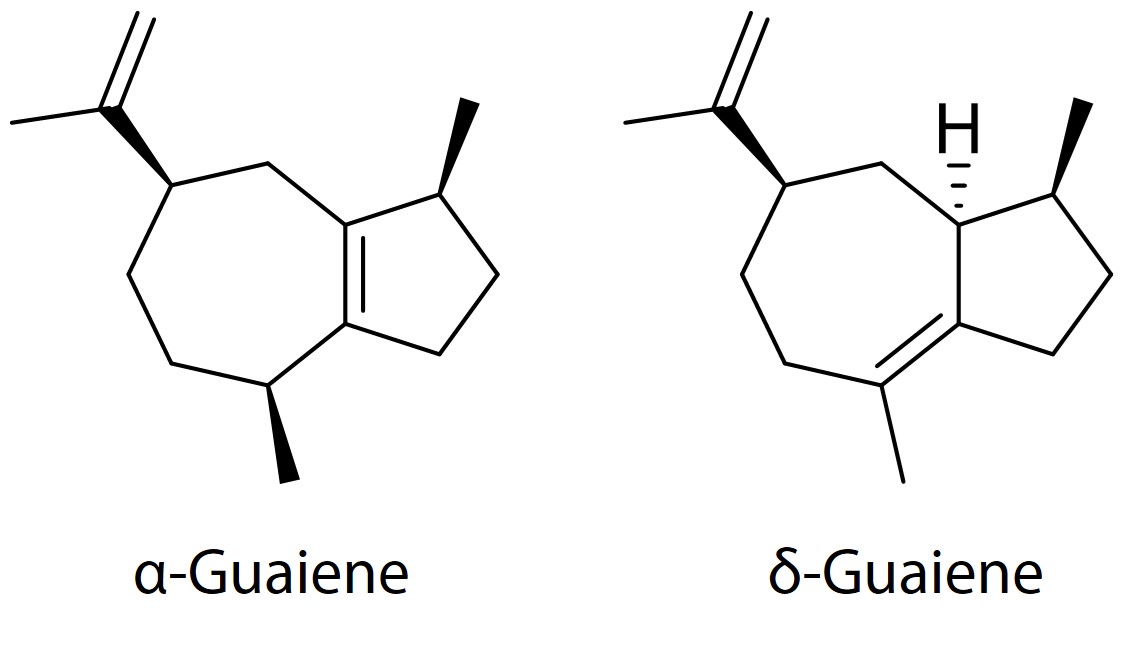
  • • α- and δ-guaienes co-occur;
  • • Germacrene B is always associated with γ-elemene by GC, since the latter is a thermal degradation product of germacrene B and therefore partly generated during analysis. (E)-α-bisabolene and α-bisabolol tend to somewhat correlate with germacrene B;
  • • Finally, a cluster of sesquiterpenols including guaiol, eudesmols, bulnesol and cryptomeridiol are clearly tied together in terms of abundance.

Behavior of Terpenes Groups Across Strains​

As we have come to test thousands of samples, some trends have become apparent within or between the groups outlined above. Here are some recurring phenomenons we observe in our tests. Keep in mind that with intensive breeding, one can still stumble upon something unusual: these are trends, not absolute rules!

Monoterpenes​

The profile of terpenes is most of the time dominated by one or several monoterpenes amongst the following: myrcene, α-pinene*, limonene*, terpinolene*, (E)-β-ocimene and linalool – the latter two very seldom being the dominant compound. Remember that those marked by an asterisk come with peers. From the perspective of chemical trends, the cases of terpinolene and limonene are particularly interesting.
In the case of terpinolene, its presence seems to be a metabolic key for the expression of several other molecules. Whenever terpinolene is a dominant terpene, a diverse group of molecules that are usually found at best as traces become more salient. Some of them are represented in figure 2.
Terpinolene-group.jpg

Figure 2. Compounds associated with terpinolene in cannabis. These molecules tend to be more abundant whenever a strain is rich in terpinolene, while being trace constituents or even entirely missing otherwise. In addition to those molecules, an unknown oxygenated monoterpene is also closely tied to terpinolene. It is eluted near terpinen-4-ol on a DB-5 column.
As for limonene, its concentration is correlated with that of camphene and several oxygenated monoterpenes including α-terpineol, endo-fenchol, and borneol, as well as pinene hydrates (figure 3). The latter are in fact relatively rare in the field of essential oils, with cannabis being one of the rare botanicals where they have some abundance alongside the rather uncommon African wild sage (or leleshwa), Tarchonanthus camphoratus.
Limonene-group.jpg

Figure 3. Structures of molecules closely correlated to limonene abundance in cannabis.
Sesquiterpenes

β-Caryophyllene and α-Humulene​

These two sesquiterpenes (figure 4) can sometimes surpass monoterpenes in terms of concentrations in a strain. They are always expressed unless a strain or extract is almost devoid of terpenes. This is not so surprising, because these terpenes are amongst the most widely distributed in nature – relatively few essential oil bearing plants do not exhibit them. It will be extremely rare to see any cannabis where the sum of caryophyllene and humulene does not account for at least 1% (relative percentage) of total terpenes, and their distribution is relatively continuous across all their possible concentrations. As such, they do not really represent a chemotype, rather a continuum.
Caryophyllane-group.jpg

Figure 4. Structures of β-caryophyllene and α-humulene
Germacrene B
As mentioned earlier, germacrene B is not thermally stable (figure 5). Whenever it shows on a GC profile, it will inevitably be accompanied by γ-elemene, into which it partially rearranges within the heated injection port of the instrument [3]. These usually will not be featured in terpenes screens in most laboratories, because the germacrene B standard is hard to obtain – but it can nevertheless be a quantitatively important constituent of terpenes in some strains. We have seen the sum of germacrene B and γ-elemene reach well over 10 mg/g in some cases! And there are instances where germacrene B is almost missing entirely, with almost all possibilities in-between.
There is some degree of correlation between germacrene B and the pair of closely related compounds (E)-α-bisabolene and α-bisabolol, although in that case we sometimes observe examples where they are decoupled. The α-bisabolene/bisabolol pair exhibits some chemotypical behavior, where they are most of the time expressed in strains, but once in a while inhibited to very low levels.
Germacrene-B-group.jpg

Figure 5. Structures of germacrene B and fully or partially correlated compounds.
Guaienes
α-Guaiene and δ-guaiene (figure 6) are typically found in rose and patchouli essential oils, among others. In many cannabis strains, these sesquiterpenes will be rather faintly expressed, but in some cases, their expression is triggered to account for a few relative points of percentage of total terpenes. In all honesty, this is difficult to track from α-guaiene only, because it tends to coelute with another quantitatively abundant sesquiterpene of cannabis, trans-α-bergamotene, on many GC columns (DB-5 and DB-Wax included). δ-Guaiene is therefore the good cue to look at for this chemotype. There are exceptions, but together the guaienes will typically either account for under 0.5 mg/g of terpenes or be found in the 1-3 mg/g bracket, which would suggest that there is a genetic trait that either allows or inhibits their production. α-Guaiene can oxidize over time into a potent odorant compound, rotundone [4] – it is probably too faint to be monitored directly in cannabis but could contribute to the aroma of some strains.
Guaienes-group.jpg

Figure 6. Structures of guaienes.
Eudesmanes (Selinanes)
This is one group of sesquiterpenes (figure 7) that you do not want to miss if you want an accurate account of the terpenes content of a strain. Selinadienes are, in many strains, amongst the most abundant terpenes overall, sometimes contributing well over 10 mg/g in total. As far as we are aware, cannabis is also the botanical where these molecules are the most prominent. The fact that our screen takes them into account whereas many laboratories disregard them goes a long way to explain the difference in “total terpenes” reported – and keep in mind the concept of total terpenes requires precautions.
Eudesmane-group.jpg

Figure 7. Structures of the main eudesmane-type sesquiterpenes found in cannabis, and the correlated spirovetiva-1(10),7(11)-diene and eremophila-1(10),7(11)-diene. The group also includes selina-4,7(11)-diene.
There appears to be chemotypes with regards to eudesmanes, too. In a few strains, they are almost absent, implying that the absence of a given gene inhibits their metabolism.

Bulnesol/guaiol/eudesmols Sesquiterpenols​

One last interesting group comprises several molecules that are closely correlated (figure 8), including bulnesol, guaiol and several eudesmol isomers. Except for cryptomeridiol, they are all featured roughly in the same amounts, and they follow a presence/absence chemotypical pattern. Some strains clearly express the group, whereas the molecules are found in traces only in other cases. In our experience, this is one of the most variable metabolic traits between strains, along with the dominant monoterpenes.
Eudesmols-group.jpg

Figure 8. Compounds correlated in a cluster of sesquiterpenols found in cannabis, with none of them clearly dominating the rest.
Bottom Line
The proportions between terpenes can be useful tools to describe strains. Our full terpenes service comes with a short conclusion that will highlight a few trends regarding the groups discussed above, and we keep thinking of good ways to capture the terpenes chemotypes in cannabis to better convey this information to our customers in the future.

References​

[1] Polatoglu, K. “Chemotypes”– A Fact That Should Not Be Ignored in Natural Product Studies. Nat. Prod. J. 2013, 3 (1), 10–14. https://doi.org/10.2174/2210315511303010004.
[2] de Meijer, E. The Chemical Phenotypes (Chemotypes) of Cannabis. In The Handbook of Cannabis; Pertwee, R. G., Ed.; Oxford University Press: Oxford, 2014; pp 89–110.
[3] Venditti, A. What Is and What Should Never Be: Artifacts, Improbable Phytochemicals, Contaminants and Natural Products. Nat. Prod. Res. 2020, 34 (7), 1014–1031. https://doi.org/10.1080/14786419.2018.1543674.
[4] Huang, A.-C.; Burrett, S.; Sefton, M. A.; Taylor, D. K. Production of the Pepper Aroma Compound, (−)-Rotundone, by Aerial Oxidation of α-Guaiene. J. Agric. Food Chem. 2014, 62 (44), 10809–10815. https://doi.org/10.1021/jf504693e.

https://en.wikipedia.org/wiki/Tetrahydrocannabivarin#Biosynthesis

Biosynthesis​

Unlike THC, cannabidiol (CBD), and cannabichromene (CBC), THCV doesn't begin as cannabigerolic acid (CBGA). Instead of combining with olivetolic acid to create CBGA, geranyl pyrophosphate joins with divarinolic acid, which has two fewer carbon atoms. The result is cannabigerovarin acid (CBGVA). Once CBGVA is created, the process continues exactly the same as it would for THC. CBGVA is broken down to tetrahydrocannabivarin carboxylic acid (THCVA) by the enzyme THCV synthase. At that point, THCVA can be decarboxylated with heat or UV light to create THCV.[12]
 

Attachments

  • 1726706719861.png
    1726706719861.png
    831.8 KB · Views: 20
Last edited:

acespicoli

Well-known member

A physical and genetic map of Cannabis sativa identifies extensive rearrangements at the THC/CBD acid synthase loci​

A physical and genetic map of Cannabis sativa identifies extensive rearrangements at the THC/CBD acid synthase loci​

Kaitlin U Laverty 1, Jake M Stout 2, Mitchell J Sullivan 3, Hardik Shah 3 4, Navdeep Gill 5, Larry Holbrook 6, Gintaras Deikus 3 4, Robert Sebra 3 4, Timothy R Hughes 1 7 8, Jonathan E Page 5 9, Harm van Bakel 1 3 4

Abstract​

Cannabis sativa is widely cultivated for medicinal, food, industrial, and recreational use, but much remains unknown regarding its genetics, including the molecular determinants of cannabinoid content. Here, we describe a combined physical and genetic map derived from a cross between the drug-type strain Purple Kush and the hemp variety “Finola.” The map reveals that cannabinoid biosynthesis genes are generally unlinked but that aromatic prenyltransferase (AP), which produces the substrate for THCA and CBDA synthases (THCAS and CBDAS), is tightly linked to a known marker for total cannabinoid content. We further identify the gene encoding CBCA synthase (CBCAS) and characterize its catalytic activity, providing insight into how cannabinoid diversity arises in cannabis. THCAS and CBDAS (which determine the drug vs. hemp chemotype) are contained within large (>250 kb) retrotransposon-rich regions that are highly nonhomologous between drug- and hemp-type alleles and are furthermore embedded within ∼40 Mb of minimally recombining repetitive DNA. The chromosome structures are similar to those in grains such as wheat, with recombination focused in gene-rich, repeat-depleted regions near chromosome ends. The physical and genetic map should facilitate further dissection of genetic and molecular mechanisms in this commercially and medically important plant.

Authors​

  1. Kaitlin U. Laverty1,
  2. Jake M. Stout2,
  3. Mitchell J. Sullivan3,
  4. Hardik Shah3,4,
  5. Navdeep Gill5,
  6. Larry Holbrook6,
  7. Gintaras Deikus3,4,
  8. Robert Sebra3,4,
  9. Timothy R. Hughes1,7,8,
  10. Jonathan E. Page5,9 and
  11. Harm van Bakel1,3,4
  12. 1Department of Molecular Genetics, University of Toronto, Toronto, Ontario M5S 1A8, Canada;
  13. 2Department of Biological Sciences, University of Manitoba, Winnipeg, Manitoba R3T 2N2, Canada;
  14. 3Department of Genetics and Genomic Sciences, Icahn School of Medicine at Mount Sinai, New York, New York 10029, USA;
  15. 4Icahn Institute for Data Science and Genomic Technology, Icahn School of Medicine at Mount Sinai, New York, New York 10029, USA;
  16. 5Department of Botany, University of British Columbia, Vancouver, British Columbia V6T 1Z4, Canada;
  17. 6CanniMed Therapeutics Incorporated, Saskatoon, Saskatchewan S7K 3J8, Canada;
  18. 7Donnelly Centre, University of Toronto, Toronto, Ontario M5S 3E1, Canada;
  19. 8Canadian Institute for Advanced Research, Toronto, Ontario M5G 1M1, Canada;
  20. 9Anandia Labs, Vancouver, British Columbia V6T 1Z4, Canada
Domesticated thousands of years ago (Li 1974), Cannabis sativa has been subjected to intensive breeding, resulting in extensive variation in morphology and chemical composition. It is perhaps best known for producing cannabinoids, a unique class of compounds that may function in chemical defense (Pate 1994) but also have pharmaceutical and psychoactive properties. Heat converts the cannabinoid acids (e.g., tetrahydrocannabinolic acid [THCA]) to neutral molecules (e.g., (–)-trans-Δ9–tetrahydrocannabinol [THC]) that bind to endocannabinoid receptors found in the vertebrate nervous system. This pharmacological activity leads to analgesic, antiemetic, and appetite-stimulating effects and may alleviate symptoms of neurological disorders, including epilepsy (Devinsky et al. 2014) and multiple sclerosis (van Amerongen et al. 2018). There are over 113 known cannabinoids (Elsohly and Slade 2005), but the two most abundant natural derivatives are THC and cannabidiol (CBD). THC is responsible for the well-known psychoactive effects of cannabis consumption, but CBD, while nonintoxicating, also has therapeutic properties and is specifically being investigated as a treatment for both schizophrenia (Osborne et al. 2017) and Alzheimer's disease (Watt and Karl 2017). Cannabis has traditionally been classified as having a drug (“marijuana”) or hemp chemotype based on the relative proportion of THC to CBD, but types grown for psychoactive use produce relatively large amounts of both. Cannabis containing high levels of CBD is increasingly grown for medical use.
THCA and CBDA are both synthesized from cannabigerolic acid (CBGA) by the related enzymes THCA synthase (THCAS) and CBDA synthase (CBDAS), respectively (Sirikantaramas et al. 2004; Taura et al. 2007). Expression of THCAS and CBDAS appear to be the major factor determining cannabinoid content, but the mechanisms that underlie the expression of these enzymes remain unresolved. Two competing theories are supported by existing data. In one, CBDAS and THCAS are mutually exclusive alleles (i.e., very different isoforms, as the protein sequences are only 84% identical). Genetic analysis supports this model, with approximately 1:2:1 segregation of chemotypes in a cross of drug type versus hemp (de Meijer et al. 2003). An alternative model is that THCAS and CBDAS are closely linked (i.e., adjacent on a chromosome), and one or the other is inactivated in drug-type or hemp strains. This model was motivated by the discovery of a THCAS-like gene in hemp plants (Kojoma et al. 2006) and is consistent with the possibility that these related genes are derived from an ancient tandem duplication. In addition, physical linkage of genes involved in specialized metabolic pathways has been repeatedly observed in plants, similar to operons in bacterial genomes (Nützmann and Osbourn 2014); such a cluster was recently described for benzylisoquinoline alkaloid biosynthesis genes in opium poppy (Guo et al. 2018). It is unknown whether genes involved in cannabinoid biosynthesis are clustered, although genetic analyses have previously indicated that at least one locus unlinked to THCAS/CBDAS contributes to cannabinoid content (Weiblen et al. 2015).
The draft genome and transcriptome of C. sativa described in 2011 (for a female plant of the drug-type strain Purple Kush [PK] and resequencing of a plant of the hemp variety “Finola” [FN]) (van Bakel et al. 2011) was unable to discriminate between these models due to high fragmentation. The C. sativa draft genome assembly, done largely with Illumina sequencing, was composed of 136,290 scaffolds, with an N50 of 16.2 kb. It was subsequently demonstrated that ∼70% of the C. sativa draft genome is composed of repetitive sequences (Pisupati et al. 2018). Measurement of single-nucleotide variants (SNVs) in four strains showed rates of heterozygosity ranging from 0.18%–0.26% and revealed that the drug-type and hemp-type strains were well separated by SNVs; the rate of occurrence of SNVs between these types was as high as 0.64% (van Bakel et al. 2011). Cytogenetic analysis has furthermore suggested a high degree of inter- and intracultivar karyotype polymorphisms (i.e., differences in homologous chromosomes that can be observed by microscopy), at least among hemp varieties (Razumova et al. 2016), which may further complicate genome assembly. To address these complications and to simultaneously leverage the high rate of SNVs between PK and FN, we coupled Pacific Biosciences (PacBio) long-read single-molecule real-time (SMRT) sequencing of PK and FN with Illumina resequencing of 99 F1 progeny between the two in order to generate a combined genetic and physical map. The combined map provides new insights into the arrangement of the chromosomes and the cannabinoid biosynthetic genes, including discovery of substantial rearrangement and gene duplications at the closely linked THC and CBD acid synthase gene loci.

Results​

A combined genetic and physical map reveals that genes and recombination events are concentrated near chromosome ends​

We performed PacBio SMRT sequencing of genomic DNA (gDNA) from the female parent PK and the male parent FN to a depth of ∼79× and ∼98×, respectively. We used these data to develop an initial set of scaffolds, using the FALCON assembler (Chin et al. 2016), with PK and FN analyzed separately (Table 1). The assemblies were further polished with Illumina data using Pilon (Walker et al. 2014) to correct indel errors associated with homopolymer repeats in the PacBio data. The FN assembly was more contiguous than the PK assembly (scaffold N50 of 445.6 vs. 146 kbp, respectively), likely reflecting the increased FN coverage and the use of a more recent sequencing chemistry, and each substantially improved on our original Illumina assembly (Supplemental Fig. S1; van Bakel et al. 2011). De novo repeat classification using RepeatModeler (http://www.repeatmasker.org/RepeatModeler/) confirmed that the sequence of both assemblies is highly repetitive (∼73%) (Supplemental Fig. S2), with hundreds of distinct families. The two sets of scaffolds largely mapped to each other one-to-one (Supplemental Fig. S3) but with differing breakpoints that mostly reflected differences in scaffold boundaries. The total size of the PK and FN assemblies was close to the haploid genome size estimated by flow cytometry (818 and 843 Mb for female and male, respectively) (Sakamoto et al. 1998). Overall, 90.3% of 30,074 previously described PK transcripts (van Bakel et al. 2011) mapped to the PK assembly (82.3% mapping completely within a single scaffold). Each assembly also contained >95% of eudicotyledon single-copy orthologs from OrthoDB, of which >97% were complete (Supplemental Fig. S4), indicating that both assemblies represented the vast majority of the cannabis gene space. An ortholog duplication rate of >14% and slightly larger than expected assembly sizes suggest that some regions of the diploid genomes were resolved into separate contigs, which can be an issue for polymorphic species (Shimizu et al. 2017).
View this table:
Table 1.
Genome assembly statistics

We reasoned that a genetic map would provide an independent means to link scaffolds, in addition to being independently useful for genetic analysis. To generate a genetic linkage map, we employed the SOILoCo pipeline, created by Scaglione et al. (2016) to create a map of the artichoke genome. We applied the pipeline to F1 data from a cross between a PK female and FN male. SOILoCo requires phasing of the parental scaffolds into blocks in which parental haplotypes can be uniquely identified. It then uses SNVs in the offspring to determine which of the parental haplotypes is inherited for each F1 at each block. The inherited parental haplotypes are called using a hidden Markov model, which compensates for uncertainty in genotype calling caused by relatively low coverage typical of resequencing, by taking advantage of the multiple SNVs in each block. Because each of the four parental haplotypes is traced uniquely, recombination frequencies between blocks (and thus between scaffolds) can subsequently be calculated, and the recombination frequencies can be used to place blocks (and scaffolds) into linkage groups. Since the blocks of informative SNVs differ between the parental types, a separate genetic map is created for each parent (in this case, PK and FN). In our implementation, we identified phased haplotype blocks of physically linked unique SNVs in the FN assembly contained within PK or FN PacBio raw reads using HapCUT2 (Table 1; Edge et al. 2017), and scored them in 99 F1 progeny using Illumina sequencing (median coverage about 4×). We then ran the SOILoCo pipeline, followed by R/qtl (Broman et al. 2003) and MSTmap (Wu et al. 2008), to form linkage groups and order scaffolds within them.
The blocks formed 10 large linkage groups in both PK and FN, which we assume correspond to the established nine autosomes and X/Y (which contain a pseudoautosomal region and recombine) (Peil et al. 2003) and are hereafter referred to as chromosomes. The maps were largely consistent between PK and FN (Supplemental Fig. S5) and were therefore merged (MergeMap) (Wu et al. 2011). The merged genetic map is depleted for short scaffolds, repetitive sequence, and scaffolds containing a higher proportion of SNVs with segregation distortion (these SNVs are ignored by SOILoCo). The merged map contains 2952/5304 scaffolds, 784/1006 Mb (78%) of the initial sequence, 89% of eudicotyledon single-copy orthologs, and 21,168/30,074 of all PK transcripts (70.4%) (Table 1; Supplemental Fig. S4).
Figure 1A plots composite physical versus genetic distance across the chromosomes, with several major trends in the chromosomal sequences also illustrated (Supplemental Fig. S5 shows similar graphs and also plots of genetic vs. physical distance, as well as a comparison of recombination frequencies, for all individual chromosomes). First, there is a very strong tendency for recombination to occur near chromosome ends, while there are typically large blocks lacking recombination events across the middle of the chromosome. Second, genes are much more frequent near chromosome ends. Because promoters and enhancers are typified by open chromatin, which appears to promote crossovers in diverse species, including maize (Liu et al. 2009) and Arabidopsis thaliana (Choi et al. 2013), this arrangement may underlie the observed recombination frequencies. Third, the poorly recombining central parts of chromosomes not only are gene-poor but also have a higher repeat content, which may be methylated and could suppress recombination (Zamudio et al. 2015). Fourth, assuming that the centromere is located within the nonrecombining central segments of the chromosomes, then Chromosomes 5, 9, and 10 appear to be telocentric (i.e., behave as if they have a single long arm). These may represent the sex chromosome, one end of which is nonhomologous and thus nonrecombining, and Chromosomes 8 and 9 (as determined by cytogenetics) (Divashuk et al. 2014), which harbor 5S rDNA and 45S rDNA on one arm, respectively. The repetitive nature of these regions would be expected to impede both assembly and mapping. Indeed, four of five male-specific markers are found in the FN assembly, but none were placed on the genetic map, and the 45S and 5S rDNA are not in the assembly (Supplemental Table S1).
Figure 1.
View larger version:
Figure 1.
Comparison of physical and genetic distance in Cannabis sativa and arrangement of sequence features on chromosomes. (A) Median values are indicated for all metacentric linkage groups (Chromosomes 5, 9, and 10 are excluded), scaled to the same physical length. Black points indicate the median increase in genetic distance every 1/100th of the physical distance. Shaded histograms superimposed show density of repeat sequences. Density of genes and GC content are also indicated by blue and purple lines. (B) Values for Chromosome 6, which contains the THCAS/CBDAS loci; here, black points are the representative of individual scaffolds.

Overall, the organization of C. sativa genes, repeats, and recombination frequency along chromosomes is similar to what is commonly observed in the grains (e.g., maize, barley, and wheat) (Gore et al. 2009; Liu et al. 2009; Mascher et al. 2017). To our knowledge, such an organization is unusual outside the grains: It has been observed in the walnut (Luo et al. 2015), but not thale cress (A. thaliana) (Meinke et al. 2009), apple (Di Pierro et al. 2016), strawberry (Davik et al. 2015), or mulberry (He et al. 2013), suggesting that this property is rare among Rosales.

Genomic organization of cannabinoid pathway genes​

We next examined the positions of genes encoding known cannabinoid biosynthetic enzymes on the chromosomes. With the exception of the functional copies of CBDAS and THCAS, which are considered below, the cannabinoid-related genes are distributed in a mostly random fashion across the genome (indicated in Supplemental Fig. S5). The new map also finds that C. sativa encodes one copy of AAE1 (hexanoyl-CoA synthetase) and two tandem copies of tetraketide synthase (“olivetol synthase”). The genome sequences of both PK and FN also contain the THCAS-like gene described by Kojoma et al. (2006) which led to the two-locus THCAS/CBDAS hypothesis. This THCAS-like gene is 96% identical to THCAS at the nucleotide level and encodes a protein that is 93% identical to THCAS at the amino acid level. One copy of the THCAS-like gene is found in the PK assembly (scaffold 005500F: 2986–4620), and two are found in the FN assembly (scaffold 004887F, 13943–15577; 001793F, 69162–70796).
We examined the possibility that this THCAS-like gene encoded cannabichromenic acid (CBCA) synthase (CBCAS), which is found in both drug-type and hemp strains and resembles THCAS and CBDAS in its catalytic mechanism (Morimoto et al. 1997). We expressed the predicted open reading frame as a secreted protein in Pichia pastoris strain X-33. We then added CBGA substrate to clarified culture media to test for enzyme activity. The products of this reaction were analyzed by high-performance liquid chromatography (HPLC), which revealed a specific signal for CBCA (Fig. 2A). Purification of the Pichia secreted protein through a series of chromatographic steps yielded a 59-kDa product at the expected size of CBCAS without its secretory signal sequence (calculated to be 58.9 kDa) (Fig. 2B). We next determined the kinetic properties of CBCAS after optimizing reaction conditions using the purified protein (Supplemental Fig. S6). At the optimal temperature of 40°C and a pH of 5.5, the reaction followed Michaelis–Menten reaction kinetics with a Km of 9.3 ± 2.3 µM and a kcat of 0.02 sec−1. These values are similar to those reported for CBCAS purified from cannabis floral tissue (Km = 23 µM, kcat = 0.04 sec−1) (Morimoto et al. 1998). Finally, the accumulation of CBCA correlates well with the expression of CBCAS in various cannabis tissues, with the highest concentration observed in female floral tissue and minimal amounts in the leaf, stem, and root (Fig. 2C). Taken together, these data confirm that we identified the gene encoding CBCA synthase.
Figure 2.
View larger version:
Figure 2.
Characterization of CBCAS activity and expression. (A) HPLC analysis of CBCAS activity detected in Pichia pastoris cell cultures. Chromatograms of the CBGA substrate and CBCA standards are shown together with chromatograms of the enzyme reaction in media sampled from Pichia expressing CBCA in the presence of CBGA substrate before and after boiling at 95°C for 10 min. Insets correspond to the UV-absorbance spectrum (top) and the mass spectrum derived from a single quadrapole mass spectrometer (bottom) of the compound that eluted at 10 min. (B) SDS-PAGE analysis of CBCAS expressed in P. pastoris and purified by protein chromatography. (Lane 1) Protein ladder. (2) Concentrated protein fraction exhibiting CBCAS activity. The high-molecular-weight smear is glycosylated CBCAS. (3) Same fraction as lane 2, treated with EndoHf (MW = 70 kDa). (4) EndoHf only. (C) qRT-PCR analysis of CBCAS expression in cannabis tissues. cDNA derived from cannabis tissues was used as a template for PCR reactions using CBCAS-specific primers and EF1α as a reference gene. Differential expression of CBCAS is depicted as fold-change between tissue types compared with leaves. Trichome tissue consisted of isolated trichome secretory cells. (D) Quantification of CBCA content of the developing seedlings by HPLC.

A previous study (Weiblen et al. 2015) used QTL analysis in C. sativa to associate 121 genetic markers with total cannabinoid content and THCA/CBDA ratio. Outside of THCAS/CBDAS, this study identified only one locus displaying a strong association with total cannabinoid content, at a distance of ∼1.2 cM between the trait and the marker. In our genetic map, this locus (marker ANUCS501) is linked to aromatic prenyltransferase (AP), which catalyzes the production of CBGA, the substrate of THCAS, CBDAS, and CBCAS, with a similar recombination frequency (2.1 cM in PK; 4 cM in FN). This observation suggests that either polymorphisms or differential regulation of AP contributes to cannabinoid production, presumably by controlling substrate concentration for THCAS and CBDAS. PK has greater than fivefold higher transcript levels of AP than FN (van Bakel et al. 2011), with no difference in copy number, suggesting that AP enzyme levels may be higher in drug-type plants partly due to differences in transcript levels. In addition to polymorphisms, there are multiple large (>100 bp) indels in and around the AP locus (including two within introns), which correspond mainly to LTRs, LINEs, and simple-repeat-like insertions, which could conceivably alter regulation of transcription or splicing (Fig. 3A).
Figure 3.
View larger version:
Figure 3.
Comparison of scaffolds between PK and FN assemblies. Alignments of scaffolds from PK and FN FALCON assemblies containing key cannabinoid biosynthesis enzymes are shown. Locations of exons are indicated by pink and blue lines for FN and PK, respectively. Repeat classes given are from RepeatModeler. Individual repeat types indicated were identified by manual analysis. Features of genes are further described and compared beneath the alignments. (A) Aromatic prenyltransferase (AP). (B) THCAS and CBDAS. (C) Olivetol synthase (OLS, or tetraketide synthase).

Extensive rearrangement of the cannabinoid synthase locus underlies chemotype differences between PK and FN​

Finally, we examined THCAS and CBDAS in the PK and FN genomes. The PK assembly contains only a single copy of THCAS and no exact copies of CBDAS: None have >95% identity to CBDAS at the nucleotide level. Similarly, the FN assembly contains only a single functional copy of CBDAS, while no THCAS gene is detected. These observations are confirmed by raw sequencing reads; no reads from FN map to THCAS, and no reads from PK map to CBDAS. Both genomes include the aforementioned CBCAS. This supports claims made using the draft genome and transcriptome (van Bakel et al. 2011). As expected from established segregation patterns, THCAS and CBDAS map to roughly the same region on Chromosome 6, near a known marker associated with THCA and CBDA content (ANUCS202) (Fig. 1B). However, the scaffolds that contain THCAS (in PK) and CBDAS (in FN) are dramatically different from each other, and neither has a clear counterpart in the other genome. The scaffold containing THCAS in PK does, however, contain a pseudogenic copy of CBDAS, with ∼94% identity to the known CBDAS sequence. The gene is likely nonfunctional as it has a gypsy element insertion at its center. Assuming these loci share common ancestry, there has clearly been extensive rearrangement since their divergence. The scaffold containing THCAS is ∼250 kb and that containing CBDAS is ∼750 kb, but the dotplot shown in Figure 3B illustrates almost complete lack of similarity over this span, with the exception of a large number of LTR-class retroelements. The extreme rearrangement clearly shows that these two genes do not have a simple isogenic relationship; Figure 3, A and C, illustrates more typical patterns of sequence similarity between PK and FN. The scaffold containing CBDAS is located within a much larger repeat-rich and gene-poor region of ∼39 Mb in the central section of Chromosome 6, encompassing 151 scaffolds with no recombination in either parent observed among the 99 F1s (Fig. 1B). The scaffold containing THCAS was separated from this region in a single recombination event among the 99 crosses, thus placing it at one end of this region and indicating that the THCAS and CBDAS scaffolds are at separate loci. We suggest that this repeat-rich segment of the chromosome may have hosted a series of tandem duplications and rearrangements amplifying an ancestral gene, leading to the present chromosomal organization; there is also a pseudogene with 89%–93% identity to each of THCAS, CBDAS, and CBCAS in this region. We note that this observation represents a modification of both previous models of CBDAS and THCAS arrangement: They are not isoforms at an otherwise equivalent locus, and no equivalent of THCAS (deactivated or not) is found in hemp.

Discussion​

The combined sequence/genetic map presented here is consistent with the known C. sativa karyotype and genome size, contains the vast majority of known transcripts, and largely correlates between PK and FN. To completely finish the sequence, it will most likely be necessary to further improve the resolution of the genetic map and/or leverage hybrid scaffolding technologies, e.g., by incorporating single-molecule genomic maps (Pendleton et al. 2015) or Hi-C data that provides >1 Mb phasing information (Kronenberg et al. 2018). Another future goal will be to identify and fully assemble the X/Y Chromosomes. There are numerous scaffolds in both PK and FN with no obvious counterpart in the other genome, which could represent distinctive components of the sex chromosomes and which were not captured in our genetic map.
The identification of CBCAS allows for a number of potential applications. Cannabichromene (CBC) is a weaker agonist of the cannabinoid CB1 and CB2 receptors compared with THC and CBD. However, unlike THC, both CBD and CBC have been shown to decrease nociception both by blocking the activity of ankyrin-type transient receptor potential channels that play roles in the perception of pain-inducing signals and by inhibiting the reuptake of endocannabinoids such as anandamide (Maione et al. 2011). Furthermore, CBC operates as a gastrointestinal anti-inflammatory agent in mice and protects adult neuronal stem progenitor cells in vitro (Izzo et al. 2012; Shinjyo and Di Marzo 2013). It therefore may be useful to breed medical cannabis strains with higher quantities of CBCA to treat specific ailments such as inflammatory bowel disease and Crohn's disease. Finally, the high degree of sequence similarity between CBCAS, THCAS, and CBDAS and the presence of multiple pseudogenes suggest that gene duplication and divergence has been the key driver of cannabinoid end-product diversification in cannabis. Comparative sequence analysis of the enzymes will help ascertain which amino acids are important in catalysis, and may lead to the rational design of cannabinoid biosynthetic enzymes that produce novel cannabinoids not observed in nature.
Our identification of CBCAS also clarifies a puzzling finding of Kojoma et al. (2006), who used PCR to amplify a THCAS-like gene from “fiber-type” (hemp) cannabis that contained no THCA. Based on the sequence of the gene that we show has CBCAS activity, the THCAS-like gene amplified by Kojoma et al. (2006) is CBCAS. This result makes sense, since nondrug/hemp forms of cannabis also contain CBCA.
Cannabis and cannabinoids are increasingly employed in medicine and recently have been legalized for recreational use in many jurisdictions. The new map should facilitate vastly improved genetic analysis, including QTL mapping, which will accelerate crop improvement efforts. Drug prohibition has restricted access to cannabis by plant breeders and researchers, and as a result, it has received less attention than other crops. Cannabis suffers from insect pests and widespread fungal diseases and has a number of agronomic issues such as flowering time requirements that make it difficult to grow in some environments. In addition, breeding of cannabis types with specific cannabinoid and terpene profiles is desirable for the development of new varieties for medical and recreational use. The fact that a strong and interpretable result was obtained by re-examining a previously described marker correlating with total cannabinoid content (Weiblen et al. 2015) clearly shows the potential of this approach as it applies to cannabinoid metabolism. Due to the relatively high rate of polymorphism in cannabis, it should be possible to employ resequencing (e.g., low-coverage short-read Illumina protocols) either on crosses or at a population level to associate variants or variation with traits and genes, using the genetic map.

Methods​

Plant cultivation and gDNA isolation​

A female PK plant, produced through multiple vegetative propagation generations from the original source plant used to produce the draft C. sativa genome (van Bakel et al. 2011), was pollinated by a male FN plant in an indoor growth chamber. Seeds produced from this cross were germinated under standard conditions and grown to seedling stage. gDNA was isolated from young leaves using a GenElute Genomic Miniprep Kit (Sigma-Aldrich). The secure facilities used for plant growing were licensed by Health Canada.

PacBio SMRT sequencing of the PK and FN genomes​

gDNA library preparation and sequencing were performed according to the manufacturer's instructions and reflect the P6-C4 sequencing enzyme and chemistry, respectively. PK and FN gDNA was first repurified using a 0.8× AMPure XP purification step (0.80× AMPure beads added, by volume, to each DNA sample dissolved in 200 µL EB, vortexed for 10 min at 2000 rpm, followed by two washes with 70% alcohol and finally diluted in EB), to remove small fragments and/or biological contaminant. The purified DNA sample was taken through DNA damage and end-repair steps. Briefly, the DNA fragments were repaired using DNA damage repair solution (1× DNA damage repeat buffer, 1× NAD+, 1 mM ATP high, 0.1 mM dNTP, and 1× DNA damage repeat mix) with a volume of 21.1 µL and incubated at 37°C for 20 min. DNA ends were repaired next by adding 1× end repair mix to the solution, which was incubated at 25°C for 5 min, followed by the second 0.45× Ampure XP purification step. Next, 0.75 µM of blunt adapter was added to the DNA, followed by 1× template prep buffer, 0.05 mM ATP low, and 0.75 U/µL T4 ligase to ligate (final volume of 47.5 µL) the SMRTbell adapters to the DNA fragments. This solution was incubated at 25°C overnight, followed by a 65°C 10-min ligase denaturation step. After ligation, the library was treated with an exonuclease cocktail to remove unligated DNA fragments using a solution of 1.81 U/µL Exo III 18 and 0.18 U/µL Exo VII and then incubated at 37°C for 1 h. Two additional 0.80× Ampure XP purifications steps were performed to remove <1000-bp molecular-weight DNA and organic contaminant.
Size-selection was confirmed using the Agilent bioanalyzer, and the mass was quantified using a Qubit assay before proceeding with primer annealing and DNA sequencing. For PK, 100 pM of SMRTbell libraries were mag bead loaded and sequenced with a combination of P5/C3 and P6/C4 chemistry on a PacBio RSII machine with 6-h movies. For FN, 3 pM of SMRTbell libraries were diffusion-loaded and sequenced on a Sequel machine with v2 chemistry and 10-h movies.

FALCON assembly and Illumina polishing​

FALCON (Chin et al. 2016) was used to generate genome assemblies for PK (v0.4.0) and FN (v1.8.6). Briefly, raw subread data were filtered to remove the shortest reads to an approximate coverage of 70× for each genome, leaving 8,003,220 (80.2%) of subreads for PK and 6,646,226 (62.6%) of subreads for FN, or ∼58 Gbp for each. Preassembled reads (i.e., error-corrected reads) were then created with a length cutoff of ≥6000 bp for PK and ≥7000 bp for FN, resulting in 2,239,051 and 5,323,023 preassembled reads, respectively. The PK and FN genomes were then assembled using preassembled reads with a minimum length of 9 kbp or 7 kbp, respectively. Additional relevant assembly parameter settings for FN were as follows:
  • pa_HPCdaligner_option: -B128 -t16 -e0.8 -M24 -l1200 -k18 -h256 -w8 -s100 -T12
  • ovlp_HPCdaligner_option: -B128 -M24 -k24 -h600 -e.92 -l1800 -s100 -T12
  • falcon_sense_option: --output_multi --min_cov_aln 4 --min_idt 0.70 --min_cov 4
  • --max_n_read 200
  • falcon_sense_skip_contained: False
  • overlap_filtering_setting: --max_diff 120 --max_cov 120 --min_cov 4
Similar assembly parameters were used for PK, except that min_cov was set to 3.
Each FALCON assembly was corrected with paired-end Illumina reads using Pilon version 1.22 (Walker et al. 2014) after mapping available Illumina sequencing data (van Bakel et al. 2011) to the FALCON-assembled genomes using BWA-MEM (version 0.7.8) (Li 2013) with an average of 96× (PK) and 23× (FN) coverage. Correction was performed with the “diploid” flag and the “bases” flag set to correct only indels and SNPs. A total of 1,511,828 insertions and 228,876 deletions were corrected in the FN assembly, and 1,807,453 insertions and 283,918 deletions were corrected in the PK assembly.

Repeat content analysis​

Repeats in the FN and PK genomes were predicted de novo and classified using RepeatModeler (v1.0.11; http://www.repeatmasker.org/RepeatModeler/). RepeatModeler was applied to each assembly with the “ncbi” engine (RMBlast v2.2.28) provided with RepeatModeler. Other prerequisite components installed with the RepeatModeler package included RECON v1.0.8 and RepeatScout v1.0.5 (Price et al. 2005), Tandem Repeat Finder v4.0.4 (Benson 1999), and Repbase-derived RepeatMasker libraries (http://www.girinst.org/server/RepBase/) from January 2017. The de novo repeat classification provided by RepeatModeler was filtered to remove families with a >1-kb BLAT (Kent 2002) alignment to PK transcripts. The final filtered RepeatModeler output was then used as input for RepeatMasker (Smit et al. 2013–2015) to produce a masked version of the assembly and obtain the genomic positions of annotated repeats.

Assessment of genome assembly completeness​

The completeness of each genome assembly was assessed using BUSCO v3.0 (Simão et al. 2015) and the set of eudicotyledons single-copy orthologs from OrthoDB v10, with default arguments in the provided virtual machine instance.

Comparison of PK and FN scaffolds​

PK and FN assemblies were aligned using LASTZ (Harris 2007) version 1.04.00 with the -ungapped and -notransitions options and a step of 20. Alignments with an identity of ≤95% and a length of ≤2000 bp were removed. To produce a dotplot, FN contigs were initially ordered by size along the y-axis. Next, PK contigs were ordered and orientated on the x-axis by the position of their best hit on the y-axis. FN contigs were then reordered on the y-axis according to their best hit to the newly ordered contigs on the x-axis. This process was repeated until the order of contigs on the x-axis, and the order of contigs on the y-axis converged.

Illumina sequencing of the FN and F1 individuals​

Dual-indexed libraries were prepared using the Nextera DNA library preparation kit (Illumina), pooled equimolar, and sequenced on the HiSeq 2500 platform, yielding 529.9 Gbp total. FN was sequenced independently on the NextSeq 500 platform, yielding 49.9 Gbp.

Building the genetic map​

Quality filtering​

Barcode and adapter sequences were filtered from all FN and F1 Illumina PE reads. FN reads were further filtered using Sickle with the flags -q 20 -l 125 (https://github.com/najoshi/sickle) (version 1.33). PK Illumina 2×100 PE reads from the 2011 draft genome were also filtered using Sickle, with the flags -q 20 -l 90.

Variant calling​

BWA-MEM (Li 2013) was used to map Illumina paired-end reads for FN, PK, and the F1s to the PK FALCON assembly, after which Picard (http://broadinstitute.github.io/picard/) was used for sorting, duplicate marking, and indexing the alignments. To call variants for the F1s, we used the mpileup function from bcftools (Li et al. 2009) over all of the F1 individuals and both parents to overcome spots of lower coverage in the F1s. Variants were also called individually for each parent using the GATK HaplotypeCaller (McKenna et al. 2010) to be used as input for haplotype phasing.

Phasing the parental haplotypes​

Haplotypes for the parents were phased using HapCUT2 (Edge et al. 2017), using the –pacbio 1 argument to improve accuracy with PacBio reads and the –ea 1 argument to calculate switch quality scores. As input, parental SNPs called by HaplotypeCaller on the Illumina data were provided in conjunction with PacBio raw reads. This was done to both increase the length of the resulting haplotype blocks and boost confidence in the phasing by requiring agreement between the two sets of data. To further increase confidence, we only used SNPs that had a quality score greater than 25 and read coverage between six and 46 and that were more than five bases away from an indel. Haplotype blocks were then split if the switch quality score was less than 30. Finally, only blocks with more than 10 SNPs were retained to use as input for SOILoCo.

Genotyping the F1s​

The SOILoCo method (Scaglione et al. 2016) was used to genotype the F1s at each haplotype block, using the output of HapCUT2 and the variants called by mpileup. Required values and divergence from the default parameters are as follows. For vcf2strings.pl, minor allele frequencies 1 and 2 (--MAF-1 and --MAF-2) were set to 0.25 and 0.75, respectively. This step allows the removal of any markers that may display segregation distortion (8.5% of markers show some degree of segregation distortion; scaffolds that do not get incorporated into the genetic map have an average of 20% of markers displaying significant distortion). When running gt-hmm.pl, the minimum number of variant calls in a haplotype block (--min-string) was set to six, the probability of a crossing-over event (--switch-prob) was set to 1 × 10⁻⁶, and the probability of having reads containing both alleles at a heterozygous site (--HCALL-prob) was set to 0.15. Lastly, population type (--pop) for calls2csvr.pl is set to cross pollinated (CP). This process is run separately for each parent, with the two respective sets of haplotype blocks.
The scaffold containing CBDAS and the scaffold from the PK FALCON assembly containing THCAS were genotyped separately. As both scaffolds do not have a counterpart in the other parental assembly, genotypes were extracted from variant loci that meet the following criteria: an allele frequency of 0.5 in the parent harboring the scaffold, no coverage in the opposing parent, an allele frequency of 0.5 in the F1s, and all F1s are homozygous. The scaffold containing THCAS is the only scaffold from the PK FALCON assembly that was placed in the genetic map.

Forming linkage groups​

R/qtl (Broman et al. 2003) was employed to divide haplotype blocks for each parent separately across linkage groups using the formLinkageGroups function with maximum recombination frequency (max.rf) set to 0.05 and minimum LOD (min.LOD) set to 15. The resulting linkage groups were compared against one another to identify any pairs of linkage groups with a mean recombination frequency of greater than 0.8 between the haplotype blocks they contain, in which case the switchAlleles function was used to swap the alleles for all the haplotype blocks in the smaller linkage group, and formLinkageGroups was called again. Afterward, R/qtl functions checkAlleles, switchAlleles, and formLinkageGroups were run in succession two more times to further identify and fix haplotype blocks with swapped alleles. All linkage groups with more than 100 haplotype blocks were passed to the ordering step. For PK, there were 11 linkage groups with more than 100 haplotype blocks; however, two of them just missed the cutoff for being joined together and were therefore combined. Further support for combining these linkage groups came from a comparison with the FN map, in which the scaffolds held in these two PK linkage groups were held in a single FN linkage group.

Ordering scaffolds​

Haplotype blocks were ordered within each linkage group using MSTmap (Wu et al. 2008) with the Kosambi distance function. Three rounds of ordering were done with a smoothing step in between carried out using the Perl implementation of the SMOOTH correction algorithm (van Os et al. 2005) that is provided with the SOILoCo pipeline using an error threshold of 0.85. Correspondence between the two parental sets of linkage groups was determined based on similarity in the sets of scaffolds belonging to each linkage group. To handle ambiguity in scaffold placement, if the haplotype blocks for any given scaffold were distributed over more than one linkage group within or between parental maps, a census was taken to determine the correct linkage group, and haplotype blocks that did not agree with the majority were removed. If fewer than half of the haplotype blocks were in agreement, all haplotype blocks for that scaffold were removed, and the scaffold was not placed in either parental map. Finally, for each scaffold within each map, a distribution of the genetic positions (in cM) for all haplotype blocks belonging to the scaffold was established, and any outlier blocks were removed. After removal of ambiguous haplotype blocks and scaffolds, a final round of ordering was carried out for each parental map.

Merging the genetic maps​

To translate each parental map from haplotype blocks to scaffolds in order that they could be merged, scaffold placements were determined by averaging the locations of the haplotype blocks belonging to each scaffold. The genetic maps for PK and FN were then merged using MergeMap (Wu et al. 2011) with the weight of the FN genetic map set to two and the weight of the PK genetic map set to one because it was based off the FN FALCON assembly.

Gene cloning​

CBDAS was amplified from DNA isolated from FN leaves using gene-specific primers (forward: 5′-CTGCAGGAATGAAGTACTCAACATTCTCCTTTTGG-3′; reverse: 5′-AAGCTTTCATGGTACCCCATGATGATGCCGTGGAAGAG-3′). PCR products were cloned into pCR8/GW/TOPO (Invitrogen), excised as PstI/KpnI fragments, and cloned into pPICz-alpa B (Invitrogen). The expression vectors were then transformed into P. pastoris strain X-33 (Invitrogen) by electroporation. Positive recombinants were selected for by plating transformed cells on YPD plates supplemented with 25 µg/mL phleomycin (Invivogen). To screen for activity, colonies were used to inoculate 5 mL BMG cultures, which were grown for 2 d at 37°C with shaking. The cells were then pelleted by centrifugation, resuspended in 5 mL BMM media, and grown for 4 d at 20°C with shaking with the addition of 1% methanol daily. Enzyme activity was tested by directly adding CBGA to clarified culture media, incubating overnight at 37°C, and then analyzing products by HPLC as previously described (Stout et al. 2012).

Quantitative PCR​

RNA extraction, cDNA generation, and qRT-PCR conditions were identical to those previously reported (Stout et al. 2012). CBCAS primers (forward: 5′-CGGATGTACTGTTATGCTCCAA-3′; reverse: 5′-CATTCTCCATTAAAATAAGAAAGACAA-3′) were designed from alignments of THCAS-like genes identified in the cannabis genome to ensure their selectivity. Primers were tested using cloned THCAS, CBDAS, and CBCAS as templates. Any primer set that amplified a nontarget cDNA was discarded. Primer efficiencies were extrapolated from raw amplification data using LinRegPCR (Ruijter et al. 2009).

Recombinant CBCAS enzyme expression and purification​

The culture with the highest CBCAS activity was selected for scaled up production. One milliliter of the initial culture was used to inoculate two 40 mL BMG cultures, which were grown for 2 d at 37°C. These cultures were then used to initiate two 400 mL modified BMM cultures that were buffered with 10 mM HEPES (pH 7) and were supplemented with riboflavin at 20 mg/L. These cultures were grown at 20°C with shaking at 100 RPM for 5 d, with methanol added to 1% by volume each day. The cultures were then clarified by centrifugation, and the resulting media were filtered and passed over two Bio-scale Mini CHT hydroxyapatite cartridges (Bio-Rad) at a flow rate of 1.5 mL/min at 4°C. The cartridges were then attached in series to an AKTA FPLC system (GE Healthcare) and eluted with a 75-mL linear gradient from 5 mM sodium phosphate (pH 7) to 500 mM sodium phosphate (pH 7). Active fractions were pooled, concentrated with a 30 kDa cutoff Centricon filter (Millipore), and buffer exchanged into 20 mM citrate (pH 4.7) using a PD10 column (GE Healthcare). The resulting fraction was then injected onto a MonoS 5/50 cation exchange column (GE Healthcare) and eluted with a 40-mL linear gradient of 20 mM citrate (pH 4.7) to 20 mM citrate (pH 4.7) + 500 mM NaCl. Active fractions were pooled, concentrated with a 30 kDa cutoff Centricon filter, and injected onto a Hiload 26/60 Superdex 200 size exclusion column (GE Healthcare). Proteins were eluted with a single column volume of 20 mM citrate (pH 5.0) + 150 mM NaCl. Throughout the purification, 1/10th volume of each fraction was retained for analysis to judge purity. Protein was isolated from each fraction using 15 µL of StrataClean resin (Stratagene) and analyzed by SDS PAGE.

Enzyme assays and HPLC quantification of reaction products​

To test for CBCAS enzyme activity during the protein purification, 150 µL of protein fraction was mixed with 50 µL of 500 µM sodium citrate buffer (pH 5.0) and 20 µmol of CBGA and incubated overnight at 37°C. The reactions were then extracted twice with ethyl acetate, and the organic fractions were pooled and dried in a SpeedVac concentrator. The products were then resuspended in 16 µL 50% methanol, of which 10 µL were analyzed by HPLC as previously described (Stout et al. 2012). Reactions for enzyme kinetic analyses were composed of 1 µg of purified CBCAS, 100 mM sodium citrate (pH 5.0), and 100 mM NaCl. These reactions were performed under Michaelis–Menten conditions at 40°C for 1 h. Reaction product extraction and analyses were the same as above.

Data access​

The PacBio sequence read data generated for genome assembly, the Illumina sequencing data for the FN and F1 individuals, and the PK and FN genome assemblies from this study have been submitted to the NCBI BioProject database (http://www.ncbi.nlm.nih.gov/bioproject) under accession number PRJNA73819.

Competing interest statement​

J.E.P. is the chief executive officer and shareholder of a for-profit cannabis science company, Anandia Laboratories, based in Vancouver, Canada. In this position he receives a salary. Anandia Laboratories performs analytical testing for licensed cannabis producers in Canada as well as works to develop new cannabis cultivars through breeding. L.H. was the chief research officer at CanniMed Therapeutics until May 2018. CanniMed is a for-profit company based in Saskatoon, Canada, that produces medical cannabis products for authorized patients. In this position he received compensation in the form of a salary and stock options. In June 2018 he moved to CB3 Life Sciences, where he is chief scientific officer. J.E.P. and J.M.S. have filed patent WO2015196275 on the nucleotide sequence encoding the enzyme CBCAS-based reagents, as well as methods for producing cannabinoids and/or altering cannabinoid production.

Acknowledgments​

We thank the Donnelly Sequencing Centre (DSC) for assistance with Illumina sequencing. This work was supported by grants from the Canadian Institutes of Health Research (operating grant MOP-126070 to T.R.H., J.E.P., and H.v.B.; foundation grant FDN-148403 to T.R.H.). T.R.H. is a scholar of the Canadian Institute for Advanced Research (CIFAR) and holds the John W. Billes Chair of Medical Research at the University of Toronto. H.v.B. was supported in part by the NIH, National Institute of Allergy and Infectious Diseases, grant R01 AI119145. This work was supported in part through the computational resources and staff expertise provided by Scientific Computing at the Icahn School of Medicine at Mount Sinai.

Footnotes​

This article, published in Genome Research, is available under a Creative Commons License (Attribution-NonCommercial 4.0 International), as described at http://creativecommons.org/licenses/by-nc/4.0/.

 
Last edited:

GMT

The Tri Guy
Veteran
I'm only up to post 28. Before I put my tuppence in, I want to say, incredible work. Truly man, your threads are by far the best on the site.
Now, why the sad face on 28.
You made a mistake mate.
The double helix that represents DNA does not represent the two strands of DNA intertwined. The two strands of DNA could never intertwine. They are both present in the nucleus of the cell, but exist as separate double helixes.
This is a simple thought experiment to show why the two DNA strands could never become a double helix.
The DNA from two separate lines, or even individuals, are not the same, (let's ignore double haploids etc for this), and so will be of varying lengths and content. In addition, each qua of DNA, is represented as a letter. You covered this, either a,c,g,or t. Now each T will be mirrored in the double helix as an A, each G in the DNA, mirrored as a C. It gets a little complicated when the dna says A, but let's skip over that. The point is, if it was two sets of DNA, this rule could not be followed.
So the conclusion is, the double helix is not two DNAs double helix, there are two of these in each nucleus.
Sorry but post 28 needs to be corrected to uphold the amazing standard of this thread.
 
Last edited:

acespicoli

Well-known member
I'm only up to post 28. Before I put my tuppence in, I want to say, incredible work. Truly man, your threads are by far the best on the site.
Now, why the sad face on 28.
You made a mistake mate.
The double helix that represents DNA does not represent the two strands of DNA intertwined. The two strands of DNA could never intertwine. They are both present in the nucleus of the cell, but exist as separate double helixes. What that picture represents is the DNA and it's own negative, (term nicked from old film photography), which is the rna. It is the RNA that is read, cut up, and replaced. These sections of spliced RNA, are then what leaves the cell, to create the recipes and instructions acted on. The DNA is effectively actually the negative of the instructions. The actual photo seen by the cell, the blue print for building, is the genetic mirror, the RNA.
This is a simple thought experiment to show why the DNA strands could never become a double helix.
The DNA from two separate lines, or even individuals, are not the same, (let's ignore double haploids etc for this), and so will be of varying lengths and content. In addition, each qua of DNA, is represented as a letter. You covered this, either a,c,g,or t. Now each T will be mirrored in the double helix as an A in the rna, each G in the DNA, mirrored as a C in the RNA. It gets a little complicated when the dna says A, but let's skip over that. The point is, if it was two sets of DNA, this rule could not be followed.
So the conclusion is, the double helix is not a DNA double helix, but rather DNA connected to RNA. And there are two of these in each nucleus.
Sorry but post 28 needs to be corrected to uphold the amazing standard of this thread.
I love that you came by and read that and let me know, let me see if I can get it right. Editing .... #28


Dioecy (/daɪˈiːsi/ dy-EE-see;[1] from Ancient Greek διοικία dioikía 'two households'; adj. dioecious, /daɪˈiːʃ(i)əs/ dy-EE-sh(ee-)əs[2][3]) is a characteristic of certain species that have distinct unisexual individuals, each producing either male or female gametes, either directly (in animals) or indirectly (in seed plants). Dioecious reproduction is biparental reproduction. Dioecy has costs, since only the female part of the population directly produces offspring. It is one method for excluding self-fertilization and promoting allogamy (outcrossing), and thus tends to reduce the expression of recessive deleterious mutations present in a population. Plants have several other methods of preventing self-fertilization including, for example, dichogamy, herkogamy, and self-incompatibility.

In botany
Land plants (embryophytes) differ from animals in that their life cycle involves alternation of generations. In animals, typically an individual produces gametes of one kind, either sperm or egg cells. The gametes have half the number of chromosomes of the individual producing them, so are haploid. Without further dividing, a sperm and an egg cell fuse to form a zygote that develops into a new individual. In land plants, by contrast, one generation – the sporophyte generation – consists of individuals that produce haploid spores rather than haploid gametes. Spores do not fuse, but germinate by dividing repeatedly by mitosis to give rise to haploid multicellular individuals, the gametophytes, which produce gametes. A male gamete and a female gamete then fuse to produce a new diploid sporophyte.[8]
File:Dyakis dodecahedron.gif

Diploid cells have two homologous copies of each chromosome, usually one from the mother and one from the father.

1726781430723.png

https://en.wikipedia.org/wiki/Chromosome


1726780086101.png

ComparisonDNARNA
NameDeoxyribonucleic acidRibonucleic acid
FunctionLong-term storage of genetic information; transmission of genetic information to make other cells and new organisms.Used to transfer the genetic code from the nucleus to the ribosomes to make proteins. RNA is used to transmit genetic information in some organisms and may have been the molecule used to store genetic blueprints in primitive organisms.
Structural FeaturesB-form double helix. DNA is a double-stranded molecule consisting of a long chain of nucleotides.A-form helix. RNA usually is a single-strand helix consisting of shorter chains of nucleotides.
SizeDNA is a very long molecule, which would be several centimeters long if unravelled.RNA molecules display variable length, but are much shorter than DNA. A large RNA molecule is only a few thousand base pairs long.
Composition of Bases and Sugarsdeoxyribose sugar
phosphate backbone
adenine, guanine, cytosine, thymine bases
ribose sugar
phosphate backbone
adenine, guanine, cytosine, uracil bases
LocationDNA is found in the nucleus and within mitochonria.RNA is mostly found in the cytoplasm.
PropagationDNA is self-replicating.RNA is synthesized from DNA on an as-needed basis.
Base PairingAT (adenine-thymine)
GC (guanine-cytosine)
AU (adenine-uracil)
GC (guanine-cytosine)
ReactivityThe C-H bonds in DNA make it fairly stable, plus the body destroys enzymes that would attack DNA. The small grooves in the helix also serve as protection, providing minimal space for enzymes to attach.The O-H bond in the ribose of RNA makes the molecule more reactive, compared with DNA. RNA is not stable under alkaline conditions, plus the large grooves in the molecule make it susceptible to enzyme attack. RNA is constantly produced, used, degraded, and recycled.
Ultraviolet DamageDNA is susceptible to UV damage.Compared with DNA, RNA is relatively resistant to UV damage.
StabilityDNA is more stable than RNA and resists alkaline conditions.RNA is more reactive than DNA and is not stable in alkaline conditions.
1726780296646.png


"Molecular Structure of Nucleic Acids: A Structure for Deoxyribose Nucleic Acid" was the first article published to describe the discovery of the double helix structure of DNA, using X-ray diffraction and the mathematics of a helix transform. It was published by Francis Crick and James D. Watson in the scientific journal Nature on pages 737–738 of its 171st volume (dated 25 April 1953).[1][2]

DNA_animation.gif

1726779961805.png

Diagramatic representation of the key structural features of the DNA double helix.
This figure does not depict B-DNA.
This article is often termed a "pearl" of science because it is brief and contains the answer to a fundamental mystery about living organisms. This mystery was the question of how it is possible that genetic instructions are held inside organisms and how they are passed from generation to generation. The article presents a simple and elegant solution, which surprised many biologists at the time who believed that DNA transmission was going to be more difficult to deduce and understand. The discovery had a major impact on biology, particularly in the field of genetics, enabling later researchers to understand the genetic code.
1726779907980.png


The Structure of RNA​

There is a second nucleic acid in all cells called ribonucleic acid, or RNA. Like DNA, RNA is a polymer of nucleotides. Each of the nucleotides in RNA is made up of a nitrogenous base, a five-carbon sugar, and a phosphate group. In the case of RNA, the five-carbon sugar is ribose, not deoxyribose. Ribose has a hydroxyl group at the 2′ carbon, unlike deoxyribose, which has only a hydrogen atom (Figure 9.5).

A figure showing the structure of ribose and deoxyribose sugars. In ribose, the OH at the 2' position is highlighted in red. In deoxyribose, the H at the 2' position is highlighted in red.
Figure 9.5 The difference between the ribose found in RNA and the deoxyribose found in DNA is that ribose has a hydroxyl group at the 2′ carbon.

RNA nucleotides contain the nitrogenous bases adenine, cytosine, and guanine. However, they do not contain thymine, which is instead replaced by uracil, symbolized by a “U.” RNA exists as a single-stranded molecule rather than a double-stranded helix. Molecular biologists have named several kinds of RNA on the basis of their function. These include messenger RNA (mRNA), transfer RNA (tRNA), and ribosomal RNA (rRNA)—molecules that are involved in the production of proteins from the DNA code.


Ribonucleic acid (RNA) is a polymeric molecule that is essential for most biological functions, either by performing the function itself (non-coding RNA) or by forming a template for the production of proteins (messenger RNA). RNA and deoxyribonucleic acid (DNA) are nucleic acids. The nucleic acids constitute one of the four major macromolecules essential for all known forms of life. RNA is assembled as a chain of nucleotides. Cellular organisms use messenger RNA (mRNA) to convey genetic information (using the nitrogenous bases of guanine, uracil, adenine, and cytosine, denoted by the letters G, U, A, and C) that directs synthesis of specific proteins. Many viruses encode their genetic information using an RNA genome.

Some RNA molecules play an active role within cells by catalyzing biological reactions, controlling gene expression, or sensing and communicating responses to cellular signals. One of these active processes is protein synthesis, a universal function in which RNA molecules direct the synthesis of proteins on ribosomes. This process uses transfer RNA (tRNA) molecules to deliver amino acids to the ribosome, where ribosomal RNA (rRNA) then links amino acids together to form coded proteins.

It has become widely accepted in science[1] that early in the history of life on Earth, prior to the evolution of DNA and possibly of protein-based enzymes as well, an "RNA world" existed in which RNA served as both living organisms' storage method for genetic information—a role fulfilled today by DNA, except in the case of RNA viruses—and potentially performed catalytic functions in cells—a function performed today by protein enzymes, with the notable and important exception of the ribosome, which is a ribozyme.
Double-stranded_RNA.gif

 
Last edited:

acespicoli

Well-known member
1726782731238.png

In plant cells, most DNA is located in the nucleus, although chloroplasts and mitochondria also contain part of the genetic material. The organization and inheritance patterns of this organellar DNA are quite different to that of nuclear DNA.
https://bio.libretexts.org/Bookshelves/Botany/Botany_(Ha_Morrow_and_Algiers)/03:_Plant_Structure/3.01:_Cells_and_Tissues/3.1.02:_Plant_Cell_Structure
1726782204047.png

1726782357700.png


1726782049510.png

This is my issue, need to over simplify it so I can understand it :huggg:
Always believe in breaking things down to their simplest terms
 

Attachments

  • 1726782932052.png
    1726782932052.png
    281.6 KB · Views: 19
Last edited:

GMT

The Tri Guy
Veteran
Er, yeah, wow, someone put a lot of effort into that. Unfortunately it's not actually all accurate.
Like Al said, make it simple.
Let's keep this simple.
If, if, I'll say it again, if...... One strand of mums DNA had the sequence, CCC, in loci 1000-1002,
And the other side of the double helix was dad's DNA, and was also CCC at loci 1000-1002, and a C ALWAYS connects to a G, then how would that work? How would CCC connect to CCC? It couldn't without breaking the laws of nature. Now, if it is as I, rather than winkyweb says, that the double helix consists of one strand of DNA, then the DNA can read as anything, without conflict.
The two strands of DNA can read any combination that nature has randomly thrown together without conflict. Because they aren't linked to each other.

Now, to slap winkyweb's face again, the pollen does not grow by mitosis on its own as a haploid organism (anywhere outside a lab), it joins with the female gamete. This happens prior to mitosis. The reproductive processes they label as land plants are, well, let's keep it simple, bullshit.
 
Last edited:

acespicoli

Well-known member
1726784930698.png

Im glad we had this meeting and your very knowledgeable about these things
1726785449222.png

1726785848386.png


what holds DNA together = electrostatic, valance ?
Thanks for your time !!!
Cant express how glad i am you reached out here :huggg:
 
Last edited:

GMT

The Tri Guy
Veteran
Yeah I'll bet, especially since I was partially wrong :spanky:.
Just been double checking myself. Please allow me to show my mistake.
I did some research into this over COVID, mainly to understand mRNA vaccines. I watched the videos showing DNA template strands making RNA to go out into the cell and make proteins.
A bit like this one:

As you can see, a single strand of DNA, the template strand is used, however, I did not realise that this strand had a protective cover on it. This cover is removed when making either RNA or duplicate DNA. This cover strand and the template strand, do indeed form a double helix shape.
However, as I said, this is not one strand from the mother, and one from the father, as they would be incompatible. They form separate double helixes, each having their own template strand, and corresponding cover strand.
 

acespicoli

Well-known member
Er, yeah, wow, someone put a lot of effort into that. Unfortunately it's not actually all that accurate.
Like Al said, make it simple.
Let's keep this simple.
If, if, I'll say it again, if...... One strand of mums DNA had the sequence, CCC, in loci 1000-1002,
And the other side of the double helix was dad's DNA, and was also CCC at loci 1000-1002, and a C ALWAYS connects to a G, then how would that work? How would CCC connect to CCC? It couldn't without breaking the laws of nature. Now, if it is as I, rather than winkyweb says, that the double helix consists of one strand of DNA and one strand of RNA, and the RNA is made by mirroring the DNA, then the DNA can read as anything, without conflict, as the RNA is merely a response to the content of the DNA. The two strands of DNA can read any combination that nature has randomly thrown together without conflict. Because they aren't linked to each other, but each to its own RNA.

Now, to slap winkyweb's face again, the pollen does not grow by mitosis on its own as a haploid organism (anywhere outside a lab), it joins with the female gamete. This happens prior to mitosis. The reproductive processes they label as land plants are, well, let's keep it simple, bullshit.
1726788422183.png

A sporophyte (/ˈspɔːr.əˌfaɪt/) is the diploid multicellular stage in the life cycle of a plant

Pollen production is an essential step in sexual reproduction of seed plants.
Pollen is a powdery substance produced by most types of flowers of seed plants for the purpose of sexual reproduction.[1] It consists of pollen grains (highly reduced microgametophytes), which produce male gametes (sperm cells). Pollen grains have a hard coat made of sporopollenin that protects the gametophytes during the process of their movement from the stamens to the pistil of flowering plants, or from the male cone to the female cone of gymnosperms. If pollen lands on a compatible pistil or female cone, it germinates, producing a pollen tube that transfers the sperm to the ovule containing the female gametophyte. Individual pollen grains are small enough to require magnification to see detail. The study of pollen is called palynology and is highly useful in paleoecology, paleontology, archaeology, and forensics. Pollen in plants is used for transferring haploid male genetic material from the anther of a single flower to the stigma of another in cross-pollination.[2] In a case of self-pollination, this process takes place from the anther of a flower to the stigma of the same flower.[2]

1726790490046.png

1726790527110.png


On another topic sensi seeds male regular line MLI didnt have very good luck with it.
First run terrible germination rates, they sent a free pack and credited me but I was happy with the free one.
Anyway second run no suitable Afghani T individuals, they were gonna meet up with SAD Fem NL hybrid
(ended up grabbing "Purest Indica reg line this has not been tested in the x ")
Or the Bella Ortega line. Im still looking for a suitable male long story short.
Ran thru some Super Skunks and there is considerable funk there still, not any of that sugar thing terps.
Also the yield is quite good, well in any f1 hybrid gene dominance of the male is some times hard to guess
what it will pass to the female there is the simple Mendelian thcas synthase inheritance.

The other thing is getting all the other factors right after potency the chemotype is set,
then terpenes and yield

Been trying to gather more information on sex linked genes and inheritance... not alot out there
im lacking males
going the route of male haze and afghani landraces,
seems all the f1 hybrids have run out and become tired, good male breeding lines in short supply
back to the basics to reinvent some old f1s etc 🤷‍♂️

Law of Segregation of genes​


A Punnett square for one of Mendel's pea plant experiments – self-fertilization of the F1 generation
The Law of Segregation of genes applies when two individuals, both heterozygous for a certain trait are crossed, for example, hybrids of the F1-generation. The offspring in the F2-generation differ in genotype and phenotype so that the characteristics of the grandparents (P-generation) regularly occur again.
In a dominant-recessive inheritance, an average of
25% are homozygous with the dominant trait,
50% are heterozygous showing the dominant trait in the phenotype (genetic carriers),
25% are homozygous with the recessive trait and therefore express the recessive trait in the phenotype.
The genotypic ratio is 1: 2 : 1, and the phenotypic ratio is 3: 1

simple right 🤷‍♂️

But in cannabis there is more to inheritance than the simple stuff
 
Last edited:

Latest posts

Latest posts

Top