
acespicoli
Well-known member
A combined genetic and physical map reveals
that genes and recombination events are concentrated near chromosome ends
Genome Res. 2019 Jan; 29(1): 146–156.
doi: 10.1101/gr.242594.118
PMCID: PMC6314170
PMID: 30409771
A physical and genetic map of Cannabis sativa identifies extensive rearrangements at the THC/CBD acid synthase loci
Comparison of scaffolds between PK and FN assemblies. Alignments of scaffolds from PK and FN FALCON assemblies containing key cannabinoid biosynthesis enzymes are shown. Locations of exons are indicated by pink and blue lines for FN and PK, respectively. Repeat classes given are from RepeatModeler. Individual repeat types indicated were identified by manual analysis. Features of genes are further described and compared beneath the alignments. (A) Aromatic prenyltransferase (AP). (B) THCAS and CBDAS. (C) Olivetol synthase (OLS, or tetraketide synthase).
no equivalent of THCAS (deactivated or not) is found in hemp.
Due to the relatively high rate of polymorphism in cannabis, it should be possible to employ resequencing (e.g., low-coverage short-read Illumina protocols) either on crosses or at a population level to associate variants or variation with traits and genes, using the genetic map.
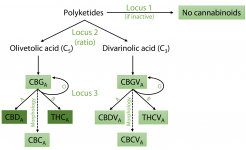
The scaffold containing CBDAS is located within a much larger repeat-rich and gene-poor region of ∼39 Mb in the central section of Chromosome 6, encompassing 151 scaffolds with no recombination in either parent observed among the 99 F1s (Fig. 1B). The scaffold containing THCAS was separated from this region in a single recombination event among the 99 crosses, thus placing it at one end of this region and indicating that the THCAS and CBDAS scaffolds are at separate loci. We suggest that this repeat-rich segment of the chromosome may have hosted a series of tandem duplications and rearrangements amplifying an ancestral gene, leading to the present chromosomal organization; there is also a pseudogene with 89%–93% identity to each of THCAS, CBDAS, and CBCAS in this region. We note that this observation represents a modification of both previous models of CBDAS and THCAS arrangement: They are not isoforms at an otherwise equivalent locus, and no equivalent of THCAS (deactivated or not) is found in hemp.
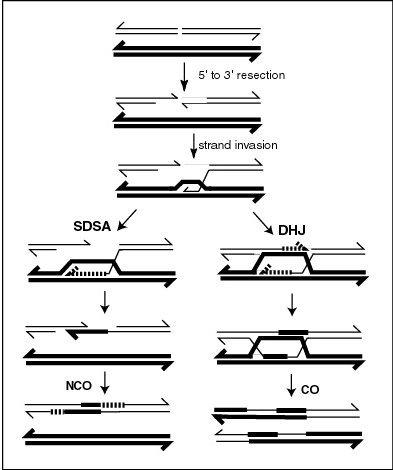
Genetic recombination - Wikipedia
Last edited:

 thanks for sharing
") and the plastoquinone, carotenoid and chlorophyll pathways (+) are indicated in the right column of the axis.
and the plastoquinone, carotenoid and chlorophyll pathways (+) are indicated in the right column of the axis.


 .
.
