What's new
  • ICMag with help from Landrace Warden and The Vault is running a NEW contest in November! You can check it here. Prizes are seeds & forum premium access. Come join in!

Have you looked at the North Pole lately?

Phaeton

Speed of Dark
Veteran
Not just un-ionized, but un-un-ionized.
Ionization is ignored, if not outright denied, by this philosophy.

The ill wind that blows no good is characterized by changes in atmospheric ionization, which also affects attitude and brain function, and is the basis for the saying.

Just another effect of climate change, albeit a small one.
 

G.O. Joe

Well-known member
Veteran
a towering cumulonimbus cloud can reach 50,000', breaking through the layered clouds and radiating heat directly into space.

By the atmosphere being divided into layers that don't mix I don't mean a layer at 4 miles and a layer at 8 miles because that isn't where the layers that I'm thinking of are. And yes radiating implies radiation and this is what I'm saying the problem is - the heating going on in this layer from the ground to there, caused by greenhouse gases absorbing long wave radiation. Do you think I don't believe in convection because trichrider says so?

Energy is transferred between the earth's surface and the atmosphere via conduction, convection, and radiation.

The sun's heat that warms the earth's surface is transported upwards largely by convection and is mixed by updrafts and downdrafts.


In all of these bodies, the tropopause separates a stratosphere with a temperature profile that is controlled by the absorption of short-wave solar radiation, from a region below characterized by convection, weather and clouds

1. And? Read again what I was replying to. My impression is that he not talking about The sun's heat that warms the earth's surface, it's something like cooling from the upper atmosphere.

The atmosphere is a cold nitrogen oxygen bath, conduction chilling the light-warmed Earth

Start there, he said, so I started right there, so trichrider says this was seized upon to discredit him. I see.

2. See 1.

3. So you do understand.
 

Phaeton

Speed of Dark
Veteran
Just playing with the fact that exceptions exist in all models, don't get me started on quantum mechanics.

The long wave radiation that is absorbed by greenhouse gasses is on a vector to head out into space when it is absorbed. The shorter wave re emission radiates spherically. In the physical world this puts half the absorbed energy roughly on its original path into space while the other half of the energy is re directed back to its source.


Theoretically, up to one and a half times the heat currently retained from the sun could be kept as a temperature rise.
Ouch.

Most greenhouse gas is water vapor, but that vapor is walking the razor's edge and CO2 or methane can trip it up.

Bad word choice, "CO2 or methane ARE tripping it up."
 

trichrider

Kiss My Ring
Veteran
Solar wind signatures throughout the high latitude atmosphere


P. Francia
M. Regi
M. De Lauretis
First published: 10 June 2018
https://doi.org/10.1029/2018JA025411

Abstract

A series of studies during the last decade have shown clear evidence of solar‐wind‐related periodicities in the variations of different parameters of the lower (troposphere/stratosphere) and upper (thermosphere/ionosphere) atmosphere, over the high latitude regions. This commentary is prompted by a recent study of the fluctuations of neutral density, winds and temperatures near 90 km, which provides evidence of such a solar‐wind‐related response in the mesosphere as well. It is timely to point out to the wider geophysical community that solar wind responses at different altitudes strongly indicate that the whole atmospheric column has a response to solar wind high‐speed streams, something that few atmospheric scientists would have anticipated 10 years ago. Reviews of the wider body of work in this research field, however, conclude that different processes of solar wind‐atmosphere coupling dominate at different altitudes, and there remain unanswered questions about some of the details of these mechanisms, and their relative importance. We therefore suggest that the studies considered here could usefully be extended in their methodology in order to constrain the mechanisms involved, rather than just identifying the solar wind driver. One example would be to examine time delays between the input, i.e. the solar wind variations, and the response at different altitudes; another is to look for latitudinal variations in the amplitude of effects.


https://agupubs.onlinelibrary.wiley.com/doi/10.1029/2018JA025411


open article by posting url [ [FONT=Arial, Helvetica, sans-serif]https://doi.org/10.1029/2018JA025411[/FONT] ]into the search function here: https://sci-hub.tw/


c'mon joe, i didn't say you didn't believe in convection, you were saying radiation excluded conduction and convection...
also the top of the atmosphere does lose heat to space from enthalpy or there would be no life on the 3rd rock from the sun.
the several atmospheres are as much insulation as sink from the electromagnetic radiation the sun produces.


from wiki: The troposphere is denser than all its overlying atmospheric layers because a larger atmospheric weight sits on top of the troposphere and causes it to be most severely compressed. Fifty percent of the total mass of the atmosphere is located in the lower 5.6 km (18,000 ft) of the troposphere.
 

trichrider

Kiss My Ring
Veteran
In Defense of the Term “Greenouse Effect”

May 9th, 2018


Over the years I have gone along with the crowd and derided the term “greenhouse effect” as a poor analogy between the atmosphere’s ability to keep the Earth’s surfce warmer than it would be without IR-absorbing (and thus IR-emitting) gases, versus a greenhouse in which plants are grown.


But the more I think about it, the more I realize that “greenhouse effect” is a pretty accurate term.


The main objection has been that the warmth within a real greenhouse is primarily due to the roof’s ability to keep warm air from escaping, thus inhibiting convective heat loss. While that is true, it is also true of the atmospheric greenhouse effect.


Remember,
1) the roof of the greenhouse is also an IR absorber and emitter, like water vapor and CO2 do in the free atmosphere, and
2) the atmospheric greenhouse effect is only fully realized in the absence of convective heat loss.


Let’s start with that second point. As originally calculated by Manabe and Strickler (1964, see slide #10 here), the greenhouse effect does not explain the average surface temperature being 288 K (observed) rather than 255K (the effective radiating temperature of the Earth absent an atmosphere). Instead it is actually much more powerful than that, and would raise the temperature to an estimated 343 K (close to 160 deg. F.) It is convective heat loss generated by an unstable lapse rate caused by the greenhouse effect that reduces the temperature to the observed value.


This is the actual “greenhouse effect” on Earth’s average surface temperature: not the oft-quoted 33 deg. C, but more like 88 deg. C of warming. (We can quibble about the calculations of surface temperature with and without greenhouse gases because they make unrealistic assumptions about clouds and water vapor.)


The point is, the atmospheric greenouse effect is radiative only, and does not include the cooling effects of convective heat transport away from the Earth’s surface.


Kind of like in a real greenhouse.


So, this actually is what happens in a real greenhouse:
1) sunlight warms the interior
2) infrared radiation absorbed and emitted by the roof reduces radiative energy loss by the air and surfaces within the greenhouse
3) convective heat loss is minimized (although it is generated on the outside surface of the roof, thus keeping the interior cooler than if there was no convective heat loss at all)


So, all things considered, I think we need to embrace the “greenhouse effect” concept. Plants like it so much, we artificially enhance Nature’s greenhouse effect (which existed before greenhouses were invented) for their benefit.


Next, let’s pump some extra CO2 in there to help the plants even more.


http://www.drroyspencer.com/
 

igrowone

Well-known member
Veteran
the sleepy days of summer, and the thread has dosed
the latest interesting news from up at the roof of the world
the arctic melt season has been drifting along at slow pace in july, which has been less common these days
the reason seems to be smoke, i.e. wood smoke like you smell at your outdoor cook outs
seems Siberia has been burning, a lot, but don't worry
 

Phaeton

Speed of Dark
Veteran
Frost last night, 28 degrees, July 19.
I surely do enjoy the warmer winters, my area gained about twenty five degrees over the last 50 winters.
The summers have lost almost ten degrees, and considering how often our summers were borderline anyway it gives us more days under 32 and fewer days over 80.

But hey, when it is -5 and the normal is -48 the cooler summer is not so bad anymore. I can take a day of frost quite easily.
 

trichrider

Kiss My Ring
Veteran
i didn't imagine this...

i didn't imagine this...


the temperature at the north pole today is -.5 Celsius.
that is below freezing.
Greenland has been getting snow, middle of July...


imagine that...


:tiphat:
 

trichrider

Kiss My Ring
Veteran
PDF


https://doi.org/10.1029/2018EA000401


Abstract

Overall climate sensitivity to CO2 doubling in a general circulation model results from a complex system of parameterizations in combination with the underlying model structure. We refer to this as the model's “major hypothesis” and we assume it to be testable. We explain four criteria a valid test should meet: measurability, specificity, independence and uniqueness. We argue that temperature change in the tropical 200‐300 hPa layer meets these criteria. Comparing modeled to observed trends over the past 60 years using a persistence‐robust variance estimator shows that all models warm more rapidly than observations and in the majority of individual cases the discrepancy is statistically significant. We argue that this provides informative evidence against the major hypothesis in most current climate models.


https://agupubs.onlinelibrary.wiley.com/doi/abs/10.1029/2018EA000401


https://sci-hub.tw/


:tiphat:
 

al70

Well-known member
i can't see it from here but i can see northern ireland from my top window, as close as i'm gonna get to the pole, cold enough here.
 

igrowone

Well-known member
Veteran
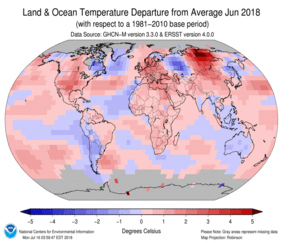
so how warm was June? the latest info
it was warm, record warm temps well outpacing record cold
notable event: Oman had its highest minimum temperature record broken
108.7°F) in Quriyat on June 26
This appears to be a new Asian record and potentially a world record warm minimum temperature

June
June 2018 Blended Land and Sea Surface
Temperature Anomalies in degrees Celsius


June 2018 Blended Land and Sea Surface
Temperature Percentiles

June 2018 was characterized by warmer-than-average conditions across much of the land and ocean surfaces, with the most notable warm temperature departures from average across central Asia where temperatures were 4.0°C (7.2°F) above average or higher. Record warm June temperatures were present across parts of central Asia as well as portions of the Atlantic, Pacific, and Indian Oceans, and Mediterranean Sea. Cooler-than-average June temperatures were observed across eastern Canada, Greenland, western and eastern Russia, and across portions of the Atlantic and Pacific oceans. The only area with record cold June temperatures was the northern Atlantic Ocean, off Greenland's southern coast.
The globally-averaged temperature across land and ocean surfaces was the fifth highest on record for June at 0.75°C (1.35°F) above the 20th century average of 15.5°C (59.9°F). The ten warmest Junes on record have occurred since 2005, with 2016 the warmest June at +0.91°C (+1.64°F). June 2018 also marks the 42nd consecutive June and the 402nd consecutive month with temperatures, at least nominally, above the 20th century average.
 

trichrider

Kiss My Ring
Veteran
Slowdown of North Atlantic circulation rocked the climate of ancient northern Europe


23.7.2018
Science
Author Minna Meriläinen-Tenhu

The scientists used intelligent computer algorithms based on machine learning when studying geological deposits from Sokli, Northern Finland. Fresh results were reported in Nature Communications recently.


Major abrupt shifts occurred in the climate of ancient northern Europe, according to a new study from University of Helsinki, Finland. The research reports that sudden cold spells, lasting hundreds of years, took place in the middle of the warm Eemian climate period, about 120 thousand years ago. These cold intervals saw a fall in temperature of a few degrees, and replacement of forests by tundra, at the study site in northern Finland. The Eemian, which took place before the last Ice Age, had a climate generally warmer than present. This has made the Eemian important for climate scientists assessing the modern climate warming.


According to the researchers, the sudden shifts of Eemian climate are connected to disturbances in North Atlantic circulation which happened during that time. Today, the warm oceanic currents of the North Atlantic maintain a relatively temperate climate in Europe. The future development of this oceanic circulation has been hard to predict, however, and possible disturbances have not been ruled out.


”These results strongly suggest that the North Atlantic circulation is sensitive to disturbance, with major effects in Northern Europe”, says University of Helsinki postdoctoral researcher Sakari Salonen who headed the study.


“Our results show that the oceanic circulation was in fact perturbed the last time climate was warmer than today. This is where our study significantly adds to the prediction of future climate done based on numerical models”, Salonen says.


The research was conducted by a multinational research group lead from the University of Helsinki. The team utilized intelligent computer algorithms based on machine learning.
“These new numerical methods significantly improve our understanding of abrupt changes of past climate”, notes professor Miska Luoto, also a team member from University of Helsinki

These results are based on a geological deposits studied in Sokli, Northern Finland. At this site, thick geological layers have been preserved in a deep depression, allowing them to survive through the following Ice Age.


“The Sokli site is unique in the northern parts of the world, which has made the site invaluable in the study of past, long-term climate change”, says Karin Helmens, a researcher from Stockholm University and a long-time coordinator of the studies at Sokli.


The study was funded by an Academy of Finland programme on long-term environmental changes and the Swedish Nuclear Fuel and Waste Management Company (SKB). The results were published in Nature Communication.


Salonen JS, Helmens KF, Brendryen J, Kuosmanen N, Väliranta M, Goring S, Korpela M, Kylander M, Philip A, Plikk A, Renssen H, Luoto M (2018) Abrupt high-latitude climate events and decoupled seasonal trends during the Eemian. Nature Communications 9:2851.


https://www.helsinki.fi/en/news/sci...rocked-the-climate-of-ancient-northern-europe


:bigeye:
 

trichrider

Kiss My Ring
Veteran
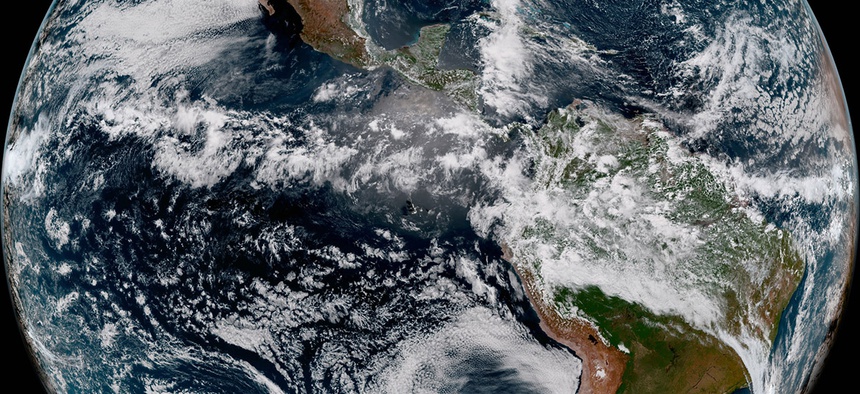
NOAA’s Next-Gen Weather Satellite is Still Malfunctioning and May Not be Fixable

860x394.jpg

NOAA
By Frank Konkel
July 24, 2018


The second satellite in NOAA’s $11 billion GOES program continues to experience issues with its most important instrument and officials still aren’t sure what’s wrong.

The National Oceanic and Atmospheric Administration’s newest weather satellite—part of the $11 billion Geostationary Operational Environmental Satellite constellation set to operate for the next 20 years—is broken and officials still aren’t sure what’s wrong or how to fix it.


Launched in March, the GOES-17 satellite was set to monitor weather events and natural disasters such as wildfires or volcanic eruptions in the western half of the United States, but officials identified cooling issues with the satellite’s primary instrument in May.


Officials told reporters Tuesday that two review teams consisting of NOAA, NASA and industry personnel continue to investigate what’s wrong with the Advanced Baseline Imager instrument and how to mitigate the loss to ensure weather forecasters on the ground continue to get high-quality satellite data.


In the meantime, GOES-17 remains in a holding pattern orbit 22,000 miles above the Earth’s surface, and the launch dates of two future GOES satellites, the next of which is scheduled for 2020, could be pushed back if experts and engineers aren’t able to figure out what went wrong with the older sibling satellite.


"There's no doubt that the problems we are experiencing with the cooling system are disappointing and not what we expected of GOES-17 when we launched,” said Steve Volz, assistant administrator for NOAA’s satellite and information service. “But we are committed to getting this right, and we will figure out what happened on [GOES-17] so it doesn’t happen with our other GOES satellites.”


Pam Sullivan, the GOES-R program director, said the loss in functionality has been traced to a loop heat pipe, an integral part of the Advanced Baseline Imager’s cooling system. The pipe carries a coolant called propylene and helps keep the instrument at its optimal temperature of -350 degrees Fahrenheit.


The pipe was made by Northrop Grumman, Sullivan said, and the company is working with officials on the ground to further investigate. The investigation suggests the most likely causes are mechanical damage to the pipe, an issue with gas inside the pipe or potentially foreign object debris, but no conclusion has been made. Tests could take up to three months, Sullivan said, and will eventually involve the manufacturer of the Advanced Baseline Imager, Harris Corp.


The cooling issue is causing the Advanced Baseline Imager instrument to work sub-optimally. The instrument looks at the earth’s surface in 16 camera channels, but the cooling issue prevents all bands from operating around the clock. Depending on sun’s position, as many as six channels will only be able to work part-time. Other instruments aboard have not been affected.
Another review team is examining how to make use of existing satellites worldwide to mitigate the loss of capability in GOES-17. Thus far, officials said forecasters have not experienced any degraded forecast data.


“Right now we have an operational constellation serving us and we’re able to carry out the mission today without any degradation,” said Joe Pica, director of the National Weather Service’s Office of Observations. “We’re fully ingrained with the teams working to resolve this issue and optimize performance.
Pica said he had “confidence in the team that we’ll come up with a solution that makes GOES-17 a significant and valuable contribution to our capabilities.”


......also:


Ageing satellites put crucial sea-ice climate record at risk​

Scientists scramble to avert disruption to data set that has tracked polar ice since the late 1970s.


GettyImages-664085338_WEB.jpg
Mario Tama/Getty
The footprint of Arctic sea ice has shrunk dramatically in the last four decades.


One of the most important continuous records of climate change — nearly four decades of satellite measurements of Arctic and Antarctic sea ice — might soon be interrupted.


Scientists all over the world rely on the sea-ice record compiled by the US National Snow and Ice Data Center (NSIDC) in Boulder, Colorado. But the US military satellites that collect the data, by measuring ice extent using microwave sensors, are approaching the end of their lives. Three are still working but ageing, and their intended successor started experiencing glitches in 2016, before conking out for good this month. The next possible replacement won't launch until at least the early 2020s (see 'Seeing ice').


That means the most complete and most scientifically significant sea-ice record is at risk of breaking. Any gap in satellite coverage is not just a short-term problem: it would compromise future research, because scientists would not be able to accurately compare observations made before the gap with those from afterward.


“Sea ice is the canary in the coal mine, and the canary’s about to fall off its perch,” says David Gallaher, an expert in satellite remote sensing at the NSIDC.


Centre analysts have begun testing the inclusion of sea-ice data from a Japanese satellite, but that spacecraft — designed to last five years — is now five years old. Experts looking to avert the looming gap will gather to debate other options, including the potential use of data from a Chinese satellite, in December, at a meeting of the American Geophysical Union in New Orleans, Louisiana.
Eyes in the sky

In addition to tracking Arctic change, the sea-ice record is also important for climate modellers. Knowing that sea ice formed at a particular location at a particular time gives the air and ocean temperature for that spot, allowing researchers to test simulations of the atmosphere and the ocean.


The data to assess sea-ice coverage come from polar-orbiting satellites carrying passive-microwave sensors that can see through clouds. The sensors detect the brightness of the surface below and translate those measurements into how much ice and water are present.


NASA began taking passive-microwave measurements of sea ice in 1972, using an instrument aboard its Nimbus-5 satellite. That sensor's failure four years later interrupted observations of phenomena such as an Oregon-sized hole that opened in the Antarctic sea ice in successive winters during the mid-1970s. By the time NASA restarted its passive-microwave measurements in 1978, the hole had vanished.
nature_news_passive-microwave-sensors_02.11.2017-online.png
Source: Walt Meier, US National Snow and Ice Data Center


Mysteriously, a large patch of open water appeared in the same region last month — the biggest spotted in four decades. Gallaher says that scientists cannot accurately compare the patch from 2017 to those seen in the 1970s, because the break in the satellite record makes it hard to calibrate Nimbus-5 observations against later ones.


“That’s why it's so critical that you have overlap” from one sea-ice satellite to the next, he says.


NSIDC analysts continued using NASA sea-ice data until 1987, when they switched to information collected by the Defense Meteorological Satellite Program (DMSP). The military uses the microwave information to detect ocean wind speeds to feed into weather models, among other uses, but the data happen to be nearly perfect for sensing sea ice, says Walt Meier, a sea-ice specialist with the NSIDC. The centre has been using DMSP data ever since.


Today, the centre uses data from three DMSP satellites that are more than 8, 11 and 14 years old — and designed to last five. A newer satellite, known as F-19, was launched in 2014 but experienced sensor problems in 2016. It became inoperable this month after tumbling out of control. The final probe in the series, the unlaunched F-20, was dismantled last year after Congress stopped funding the programme.


“Everyone kept saying we got F-20, but then it became obvious 20 wouldn’t go up,” says Gallaher. “The science community was caught kind of flat-footed.”
Tenuous times

The US military is developing another set of weather satellites to replace the DMSP series, but the one carrying a microwave sensor will not launch before 2022. That means that when the current three ageing satellites die, the United States will be without a reliable, long-term source of sea-ice data. “Every day it’s more and more risk,” says Meier. “If one of those goes it will get to be nail-biting time, and certainly if two of them go.”


For now, the centre is preparing for those scenarios by incorporating data from Japan’s AMSR2 microwave sensor into its sea-ice record. Another, more politically fraught option is to pull in data from the China Meteorological Administration’s Fengyun satellite series. Their data are already being incorporated into European weather-prediction modelling, and they carry passive-microwave sensors that are appropriate for studying sea ice. Since 2011 Congress has banned NASA scientists from working with Chinese scientists — but not necessarily from using Chinese data.
One final possibility is finding a way to launch the passive-microwave sensor that scientists at the US Naval Research Laboratory salvaged from the dismantled DMSP satellite. The sensor currently sits at the Aerospace Corporation in El Segundo, California, where researchers are trying to find a way to get it into orbit. “It’s a beautiful instrument,” says Donald Boucher, a principal scientist and engineer with Aerospace. “It must fly.”


But the military might ultimately opt to launch the sensor on something such as the International Space Station, which travels over the Earth’s low and middle latitudes. That would fulfill US troops' weather-prediction needs, but would not provide the polar orbit needed to study sea ice. Other planned military or commercial satellites might be able to provide some information about sea-ice cover, but not with the level of detail and continuity that researchers desire.


“It’s kind of frightening that you can have a record as rich and continuous as what this is, and just not a real good way of continuing it,” says Molly Hardman, a remote-sensing specialist at the NSIDC. “It’s depressing.”


https://www.nextgov.com/emerging-te...malfunctioning-and-may-not-be-fixable/149995/
...
https://www.nature.com/news/ageing-...ted&code=0ee68844-7f81-4e5c-80b2-f44bf3ca124e


click to view.


http://polarportal.dk/en/sea-ice-and-icebergs/sea-ice-thickness-and-volume/
 

igrowone

Well-known member
Veteran
been watching the satellite troubles
thing is, what if there is no more summer ice to watch?
takes care of the satellite problem i would think
but i also see there are aircraft overflying the area, better than the satellites for some things
if the arctic cap melts, it's not going to be a secret
 

Latest posts

Latest posts

Top