What's new
  • As of today ICMag has his own Discord server. In this Discord server you can chat, talk with eachother, listen to music, share stories and pictures...and much more. Join now and let's grow together! Join ICMag Discord here! More details in this thread here: here.

Have you looked at the North Pole lately?

St. Phatty

Active member
Seen numerous articles calling this a "once in a millenium" event, and they even cite some statistics to document it.

BUT, look what happened in Europe in 2003. Heat wave took them by surprise, thousands died ... no AC.

https://en.wikipedia.org/wiki/2003_European_heat_wave

Anyway, outdoor morning temps dropped to about 65 so I got the house to about 75.

If the morning house temp starts in the 80s - on a hot day - you are basically going to have a VHD - very hot day.
 

HempKat

Just A Simple Old Dirt Farmer
Veteran
for those that watch this thread but disagree with the premise
these temps should get your attention
probably won't because some seem incapable of change, not being able to change is not a survival strength

I don't think the problem is so much to do with people not noticing the temp changes or the climate changes resulting from the temp changes. At this point you would have to live under a rock to not see that there is a serious problem. I think the problem lies more in the fact that many refuse to believe these changes are caused by human activity. They seem to prefer to believe that it's all part of a natural cycle and therefore any changes we might make to help things would either have a nominal impact or no impact at all. I'll go as far as to say they might be right, there is enough evidence of other potential causes that allows for some doubt this is all human caused. So these people tend to say what's the point in changing anything if it's not going to turn all this around? Well the point or reason is this while it's difficult to blame it all on human activity 100% it's equally difficult if not impossible to say that human activity has no role in these changes. So maybe we can't stop climate change and maybe we can't turn it around but it could still be possible to at least slow things down and push back the worst impact of climate change to a later date and thereby allow us more time to come up with solutions that we don't have yet. It's kind of like when a person hits say their 60's and their health starts to fail and they know they don't have too many years left. Well at that point you don't just throw your hands up in the air and say I'm going to die before to long anyway so what's the point. No instead you take a long hard look at the things you can do to improve your health and you do those things so you can extend your life. Sure you might need to make some changes that aren't easy and you may have to give up some things you enjoy but in the end most people are glad to successfully extend their life and live as long as possible.
 

Frosty Nuggets

Well-known member
ICMag Donor
How can CO2 which is less than 0.005% of the atmosphere have any more effect on the temperature than 0.005%, is it free energy?
 

St. Phatty

Active member
How can CO2 which is less than 0.005% of the atmosphere have any more effect on the temperature than 0.005%, is it free energy?

Most of the time, the activity that occurred at the same time as the CO2 was generated, generated a lot of Heat.

But that little detail is strangely ignorred.

It's like burning a fire in a shed, noting the increase in CO2, and saying that the increase in heat is due to the presence of the CO2.
 

1G12

Active member
How can CO2 which is less than 0.005% of the atmosphere have any more effect on the temperature than 0.005%, is it free energy?

It's not the % of CO2 in relation to the other atmospheric gases that's important. It's the total amount of CO2 molecules that is important. X amount of CO2 molecules will trap X amount of heat no matter how much of other non-heat trapping gases are present. Understand?

Also........

The U.S. National Weather Service noted that temperatures reached 121 degrees in Lytton, British Columbia, Canada yesterday. Amazing!!
 

HempKat

Just A Simple Old Dirt Farmer
Veteran
The U.S. National Weather Service noted that temperatures reached 121 degrees in Lytton, British Columbia, Canada yesterday. Amazing!!

Yeah I saw that on the news, it got BC added to the list of locations of the top 10 hottest temps ever recorded. It came in at #10 all of the other 9 places were locations like Saudi Arabia and other locations where you might reasonably expect to see temps that high.
 

HempKat

Just A Simple Old Dirt Farmer
Veteran
How can CO2 which is less than 0.005% of the atmosphere have any more effect on the temperature than 0.005%, is it free energy?

Actually the percentage of the atmosphere taken up by CO2 is .038% Also the flaw in your reasoning is you're assuming all of the other components of the atmosphere also traps heat which they don't so to compare them the way you are is kind of a false equivalency. Keep in mind also that CO2 is not the only greenhouse gas and as such it's not the only thing contributing to climate change
 

trichrider

Kiss My Ring
Veteran
NASA Satellites See Upper Atmosphere Cooling and Contracting Due to Climate Change


The sky isn’t falling, but scientists have found that parts of the upper atmosphere are gradually contracting in response to rising human-made greenhouse gas emissions.
Combined data from three NASA satellites have produced a long-term record that reveals the mesosphere, the layer of the atmosphere 30 to 50 miles above the surface, is cooling and contracting. Scientists have long predicted this effect of human-driven climate change, but it has been difficult to observe the trends over time.
“You need several decades to get a handle on these trends and isolate what’s happening due to greenhouse gas emissions, solar cycle changes, and other effects,” said Scott Bailey, an atmospheric scientist at Virginia Tech in Blacksburg, and lead of the study, published in the Journal of Atmospheric and Solar-Terrestrial Physics. “We had to put together three satellites’ worth of data.”
Together, the satellites provided about 30 years of observations, indicating that the summer mesosphere over Earth’s poles is cooling four to five degrees Fahrenheit and contracting 500 to 650 feet per decade. Without changes in human carbon dioxide emissions, the researchers expect these rates to continue.

These AIM images span June 6-June 18, 2021, when the Northern Hemisphere noctilucent cloud season was well underway. The colors — from dark blue to light blue and bright white — indicate the clouds’ albedo, which refers to the amount of light that a surface reflects compared to the total sunlight that falls upon it. Things that have a high albedo are bright and reflect a lot of light. Things that don’t reflect much light have a low albedo, and they are dark.
Credits: NASA/HU/VT/CU-LASP/AIM/Joy Ng


Since the mesosphere is much thinner than the part of the atmosphere we live in, the impacts of increasing greenhouse gases, such as carbon dioxide, differ from the warming we experience at the surface. One researcher compared where we live, the troposphere, to a thick quilt.
“Down near Earth’s surface, the atmosphere is thick,” said James Russell, a study co-author and atmospheric scientist at Hampton University in Virginia. “Carbon dioxide traps heat just like a quilt traps your body heat and keeps you warm.” In the lower atmosphere, there are plenty of molecules in close proximity, and they easily trap and transfer Earth's heat between each other, maintaining that quilt-like warmth.
That means little of Earth's heat makes it to the higher, thinner mesosphere. There, molecules are few and far between. Since carbon dioxide also efficiently emits heat, any heat captured by carbon dioxide sooner escapes to space than it finds another molecule to absorb it. As a result, an increase in greenhouses gases like carbon dioxide means more heat is lost to space — and the upper atmosphere cools. When air cools, it contracts, the same way a balloon shrinks if you put it in the freezer.
This cooling and contracting didn’t come as a surprise. For years, “models have been showing this effect,” said Brentha Thurairajah, a Virginia Tech atmospheric scientist who contributed to the study. “It would have been weirder if our analysis of the data didn’t show this.”
While previous studies have observed this cooling, none have used a data record of this length or shown the upper atmosphere contracting. The researchers say these new results boost their confidence in our ability to model the upper atmosphere’s complicated changes.
The team analyzed how temperature and pressure changed over 29 years, using all three data sets, which covered the summer skies of the North and South Poles. They examined the stretch of sky 30 to 60 miles above the surface. At most altitudes, the mesosphere cooled as carbon dioxide increased. That effect meant the height of any given atmospheric pressure fell as the air cooled. In other words, the mesosphere was contracting.Earth’s Middle Atmosphere

Though what happens in the mesosphere does not directly impact humans, the region is an important one. The upper boundary of the mesosphere, about 50 miles above Earth, is where the coolest atmospheric temperatures are found. It’s also where the neutral atmosphere begins transitioning to the tenuous, electrically charged gases of the ionosphere.

This infographic outlines the layers of Earth's atmosphere. Click to explore in full size.
Credits: NASA
Explore an expanded version of this infographic.


Even higher up, 150 miles above the surface, atmospheric gases cause satellite drag, the friction that tugs satellites out of orbit. Satellite drag also helps clear space junk. When the mesosphere contracts, the rest of the upper atmosphere above sinks with it. As the atmosphere contracts, satellite drag may wane — interfering less with operating satellites, but also leaving more space junk in low-Earth orbit.
The mesosphere is also known for its brilliant blue ice clouds. They’re called noctilucent or polar mesospheric clouds, so named because they live in the mesosphere and tend to huddle around the North and South Poles. The clouds form in summer, when the mesosphere has all three ingredients to produce the clouds: water vapor, very cold temperatures, and dust from meteors that burn up in this part of the atmosphere. Noctilucent clouds were spotted over northern Canada on May 20, kicking off the start of the Northern Hemisphere’s noctilucent cloud season.
Because the clouds are sensitive to temperature and water vapor, they’re a useful signal of change in the mesosphere. “We understand the physics of these clouds,” Bailey said. In recent decades, the clouds have drawn scientists’ attention because they’re behaving oddly. They’re getting brighter, drifting farther from the poles, and appearing earlier than usual. And, there seem to be more of them than in years past.
“The only way you would expect them to change this way is if the temperature is getting colder and water vapor is increasing,” Russell said. Colder temperatures and abundant water vapor are both linked with climate change in the upper atmosphere.
Currently, Russell serves as principal investigator for AIM, short for Aeronomy of Ice in the Mesosphere, the newest satellite of the three that contributed data to the study. Russell has served as a leader on all three NASA missions: AIM, the instrument SABER on TIMED (Thermosphere, Ionosphere, Mesosphere Energetics and Dynamics), and the instrument HALOE on the since-retired UARS (Upper Atmospherics Research Satellite).
TIMED and AIM launched in 2001 and 2007, respectively, and both are still operating. The UARS mission ran from 1991 to 2005. “I always had in my mind that we would be able to put them together in a long-term change study,” Russell said. The study, he said, demonstrates the importance of long-term, space-based observations across the globe.
In the future, the researchers expect more striking displays of noctilucent clouds that stray farther from the poles. Because this analysis focused on the poles at summertime, Bailey said he plans to examine these effects over longer periods of time and — following the clouds — study a wider stretch of the atmosphere.
 

igrowone

Well-known member
Veteran
a good evening all
perhaps you've heard of the melting spike at the greenland ice sheet
perhaps not, that's why I'm sharing it
just another dramatic melting spike, happening nearly every year - at least recently
 

Attachments

  • photo2061000.jpg
    photo2061000.jpg
    32 KB · Views: 55
  • photo2061001.jpg
    photo2061001.jpg
    36.1 KB · Views: 53

armedoldhippy

Well-known member
Veteran
a good evening all
perhaps you've heard of the melting spike at the greenland ice sheet
perhaps not, that's why I'm sharing it
just another dramatic melting spike, happening nearly every year - at least recently

news says enough to cover FL with 2" of water. not sure that relates to much given the size of the planet...
 

Gry

Well-known member
Veteran
Believe the figure for the subsidy of the US oil industry is 180 billion this year.
 

St. Phatty

Active member
news says enough to cover FL with 2" of water. not sure that relates to much given the size of the planet...

If that kind of erosion occurred in California, e.g. the Lake Oroville area, it has the ability to spark a second California (metallic) gold rush (seems like California is always chasing other kinds of gold rushes, e.g. Tesla stock).

3.5 million acre feet & Lake Oroville above capacity, with the foundation of the damn eroding & engaged in a classic failure.

That was the situation in February 2017. The rains ceased, the North end of the dam survived, the main causeway did not fair so well.

If it had broken, that much water down the Sacramento River Valley, would have removed 5 to 15 feet of top dirt.

Fresh new diggings.

Of course if that land was in a South American country it would have been cyanide heap leached (for the Gold) and it would not be much of a tourist destination.

3.5 million acre feet x 44,000 square foot per acre ... 8 pounds per foot for water = like a Jack hammer.

I guess if the dam had failed it would have been even more of a tourist destination.
 

igrowone

Well-known member
Veteran
greetings brethren, hear the latest news?
you know the highest average monthly temperature since records started in 1880(or so)?
our western members may not be surprised

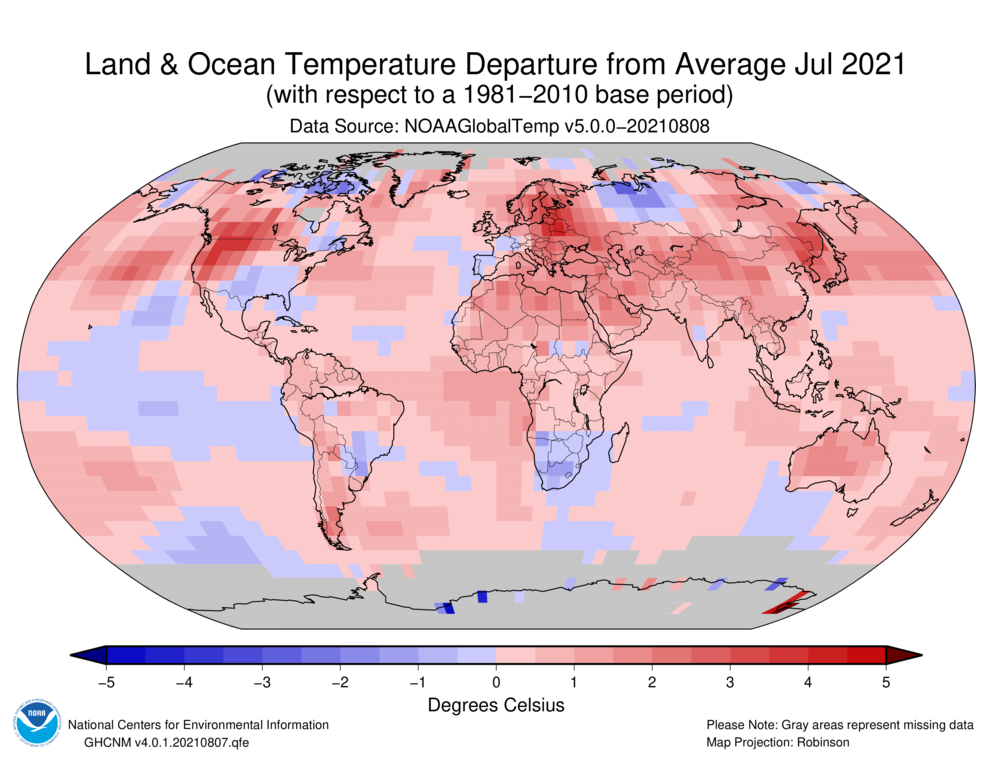
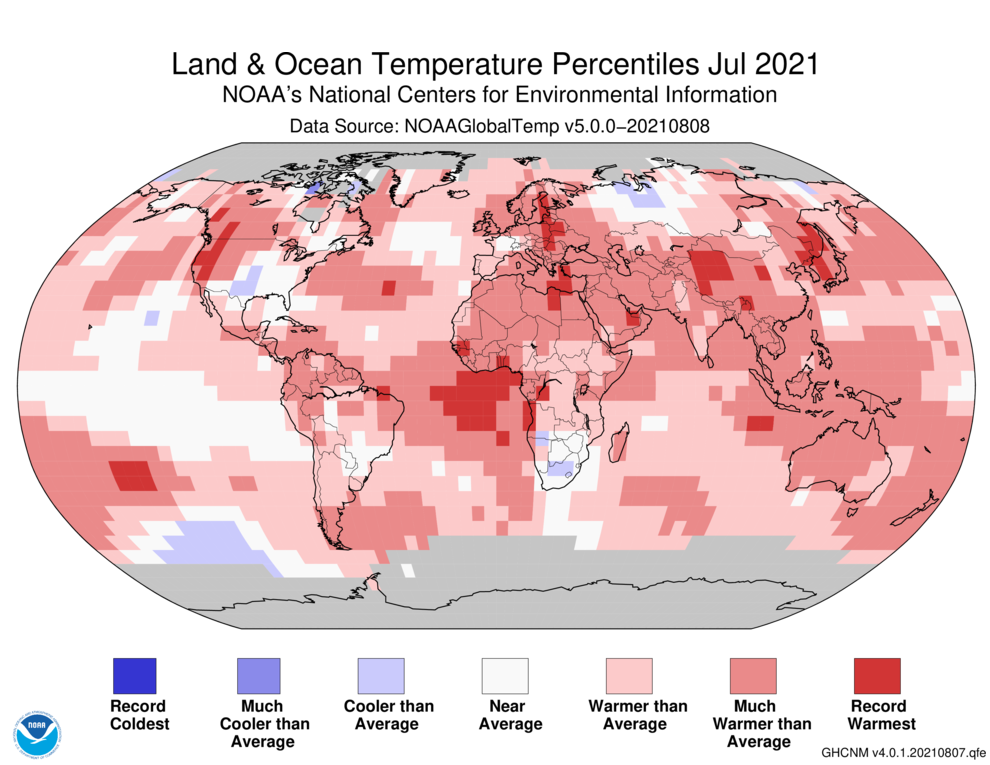
Temperature anomalies and percentiles are shown on the gridded maps below. The anomaly map on the left is a product of a merged land surface temperature (Global Historical Climatology Network, GHCN) and sea surface temperature (ERSST version 5) anomaly analysis. Temperature anomalies for land and ocean are analyzed separately and then merged to form the global analysis. For more information, please visit NCEI's Global Surface Temperature Anomalies page. The percentile map on the right provides additional information by placing the temperature anomaly observed for a specific place and time period into historical perspective, showing how the most current month, season or year compares with the past.

July 2021 Blended Land and Sea Surface Temperature Anomalies in degrees Celsius


July 2021 Blended Land and Sea Surface Temperature Percentiles

The month of July was characterized by warmer-than-average temperatures across much of the globe. Much-warmer-than-average temperatures were observed across parts of North America, northern and eastern Europe, northern Africa, the Middle East, southern Asia, northern and southern parts of Argentina, as well as the Atlantic, Pacific, and Indian oceans. Record-warm July temperatures were observed across parts of western North America, the Atlantic Ocean, Europe, northern Africa, southern Asia, and small areas across the southern Pacific and Indian oceans. The record-warm July temperatures encompassed 5.06% of the world's surface — the seventh highest July percentage for record-warm July temperatures since records began in 1951. Meanwhile, cooler-than-average conditions were present across parts of the south-central and southeastern contiguous U.S., northeastern Canada, southern Africa, northern Russia, and the southeastern Pacific Ocean. However, no land or ocean areas had a record-cold July temperature.

A positive Arctic Oscillation (AO) was present in July. The July 2021 AO value of 0.625 was the fifth highest for July since 1950. The four highest AO July values occurred in 1964 (0.734), 1989 (0.866), 1996 (0.715), and 2017 (0.634). The ridges that brought high temperature anomalies over northern Europe and northeastern Asia were associated with the positive AO.

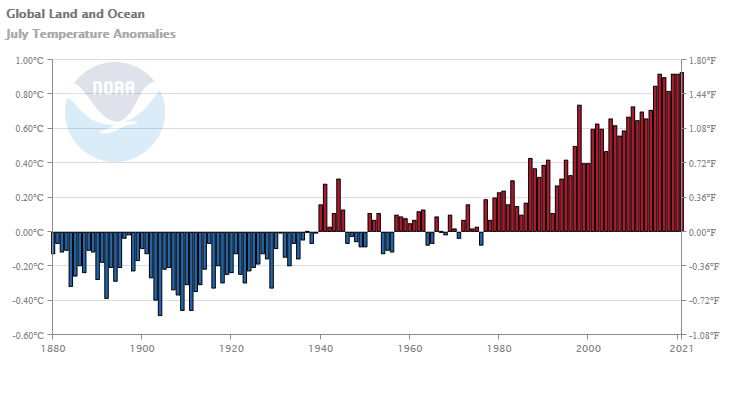
As a whole, the July 2021 global surface temperature was the highest for July since global records began in 1880 at 0.93°C (1.67°F) above the 20th-century average of 15.8°C (60.4°F). This value surpassed the previous record set in 2016 (and subsequently matched in 2019 and 2020) by only 0.01°C (0.02°F). Because July is the warmest month of the year from a climatological perspective, July 2021 was more likely than not the warmest month on record for the globe since 1880. Nine of the 10 warmest Julys have occurred since 2010, with the last seven Julys (2015-2021) being the seven warmest Julys on record. July 1998 is the only July from the 20th century to be among the 10 warmest Julys on record. July 2021 marked the 45th consecutive July and the 439th consecutive month with temperatures, at least nominally, above the 20th-century average.
 

trichrider

Kiss My Ring
Veteran
seems strange that they would exclude the pole regions in that graphic analysis.
see 1934 & 1936 & 2012.......

"Summer 1936 still remains the warmest summer on record in the USA (since official records begin in 1895). However February 1936 was the coldest February on record, and 5 of the 12 months were below average, leaving the full year 1936 at just above the average." (from Wiki)

1. Heat Wave of 1896
New York City experienced tragedy during the summer of 1896. Nearly 1,500 people died during a 10-day heat wave as temperatures reached 90 degrees with 90 percent humidity. Most of the people affected were tenement dwellers with little help from the government. It wasn’t until the end of the heat wave that then little-known Police Commissioner Theodore Roosevelt came the rescue of the urban poor by distributing ice to the residents.

2. Heat Wave of 1934
The United States’ hottest year on record saw 29 straight days of temperatures hitting triple digits. To top it off, during the summer of 1934, an extreme drought affected over 70 percent of Western North America.

3. Heat Wave of 1936
1936 was one of the worst years for the American people. Battered by the Great Depression, drought, and dust storms, the area of the Dust Bowl was hit especially hard by the heat wave. Temperatures hit record highs, going well over the 120-degree mark in some regions. By the end of the summer, more than 5,000 Americans had died from heat-related causes and drownings that occurred when people tried to cool off.

4. Heat Wave of 1954
From Colorado to the Carolinas, a significant portion of 11 states cooked under the 1954 heat wave. For 22 days, temperatures reached over 100 degrees. The heat damaged crops, caused power and water shortages, and generally wreaked havoc over the entire region. Three lakes dried up in the St. Louis area, and water was rationed. The estimated 300 deaths recorded mostly affected people ages 50-99.

5. Heat Wave of 1980
A mix of drought and heat made 1980 a terrible summer for the U.S. Though not as bad as earlier heat waves, this one stood out because of the damage. The economic losses were estimated at $16 billion, while the death toll was at least 1,700.

6. Heat Wave of 1988
Another heat wave coupled with a massive drought occurred in 1988. With the loss of anywhere between 5,000 and 10,000 lives, the catastrophe was devastating. The agricultural damage was estimated at $71.2 billion. Wildfires hit national parks like Yellowstone and Mount Rushmore, and rainfall from April through June registered even lower than the Dust Bowl years.

7. 1995 Chicago Heat Wave
Chicago lived through five sweltering days that resulted in approximately 700 heat-related deaths. The temperature reached 106 degrees, and record humidity levels made things worse. The tragic deaths also brought to light the disparity of wealth during times of national emergencies. The deaths mostly affected elderly, poor residents of the inner city.

8. Heat Wave of 2006
Spread throughout most of the U.S., the heat wave of 2006 saw heat-related deaths from New York to California. Temperatures climbed to over 100 degrees, and California saw the most lives lost with 126.

9. Heat Wave of 2012
The most recent heat wave is one of the worst on record. Failed crops across the Midwest cost $30.3 billion. The shortage drove up food prices, affecting the rest of the country. Combined with 123 fatalities, the loss was devastating.

https://blogs.ancestry.com/cm/summer...ever-recorded/

rebuttal of that analysis in this video.
https://www.youtube.com/watch?v=iFyFUw1Qh1w

seasons and cycles friends. it comes and goes.
stay frosty!
 

igrowone

Well-known member
Veteran
greetings folks
just another dramatic event to report
one hell of a big melt session up in greenland, this should be mainstreamed news in the next few days
it had been a slow melt season up there, but shit happens(as they say)
 

Attachments

  • photo2064755.jpg
    photo2064755.jpg
    34.7 KB · Views: 49
  • photo2064756.jpg
    photo2064756.jpg
    33.7 KB · Views: 49

Frosty Nuggets

Well-known member
ICMag Donor
Big news for ya fella, Greenland is called that because it was all green a few hundred years ago and it had nothing to do with humans.
 

HempKat

Just A Simple Old Dirt Farmer
Veteran
Big news for ya fella, Greenland is called that because it was all green a few hundred years ago and it had nothing to do with humans.

Actually it was never all green, just the southern most parts of it and Greenland got it's name as part of a fake News campaign run by Norwegian Viking Erik the Red who was exiled there for being a murderer. It was his hope that if he gave it a name that sounded nice it might attract settlers.

https://www.greenland-travel.com/inspiration/articles/facts-about-greenland/
 

armedoldhippy

Well-known member
Veteran
Actually it was never all green, just the southern most parts of it and Greenland got it's name as part of a fake News campaign run by Norwegian Viking Erik the Red who was exiled there for being a murderer. It was his hope that if he gave it a name that sounded nice it might attract settlers.

https://www.greenland-travel.com/inspiration/articles/facts-about-greenland/

yeah, "Greenland" and "Iceland" are classic misdirection terms. neither are what they are called...
 
Top