You can expand the areas where such testing occurs to make it as global as you wish.Thats not a global record is it

-
ICMag with help from Phlizon, Landrace Warden and The Vault is running a NEW contest for Christmas! You can check it here. Prizes are: full spectrum led light, seeds & forum premium access. Come join in!
You are using an out of date browser. It may not display this or other websites correctly.
You should upgrade or use an alternative browser.
You should upgrade or use an alternative browser.
Have you looked at the North Pole lately?
- Thread starter igrowone
- Start date
You can expand the areas where such testing occurs to make it as global as you wish.
Rubbish, the margin of error would be huge and not at all reliable enough to claim anything
Otay.Rubbish, the margin of error would be huge and not at all reliable enough to claim anything
You lot have been brain washed in lefty thought for 100 + years thru the education system.

 www.ncbi.nlm.nih.gov
Managed truth: The great danger to our republic
www.ncbi.nlm.nih.gov
Exactly, no proof required just belief in what you are toldOtay.
Your assumptions are incredible at times. I know folks who have done ice core sampling in Antartica.Exactly, no proof required just belief in what you are told
Your assumptions are incredible at times. I know folks who have done ice core sampling in Antartica.
What does that prove in relation to the global temp record.
whats the margin of error in their findings ?
You have a computer. Use it to do something other than shoot down science you have very little knowledge of.What does that prove in relation to the global temp record.
whats the margin of error in their findings ?
You have a computer. Use it to do something other than shoot down science you have very little knowledge of.
 what are your qualifications
you seem to be mistaken sir, please provide a link to said postYou have already posted this a few pages back
There is no "175 year global temp record" so how thefuckwould they know ????
The one starting from 1850 seems to have been disappered, how would they know what the global temp was, there is bugger all coverage in 1920 let alone 1850.
Its a SCAM
View attachment 19048787
now the global temperatures are routinely setting records each month, perhaps they're becoming a blur to you?
you don't believe its accurate ?you seem to be mistaken sir, please provide a link to said post
now the global temperatures are routinely setting records each month, perhaps they're becoming a blur to you?
"When did temperature records begin in Australia?
1910
Observations began in 1910 at the Post Office in Carnarvon, Western Australia, and after several moves it has operated as an automatic weather station since 1996. The network itself has also changed over time."
From google and complete and utter bullshit
Melb started in 1855, Sydney in 1859, Adelaide in 1887. they would be the only coverage for most of the sourthern hemisphere. its not hard to find out details from the northern hemisphere.
DYOR
no, I'm replying to your statement that I had already posted the global temperature report a few pages backyou don't believe its accurate ?
I don't see that I did, and have politely asked if you would provide a link to that duplicate post
My mistake it was for June not July, to me it looks like they copied and pasted the same shit and just replaced July for Juneno, I'm replying to your statement that I had already posted the global temperature report a few pages back
I don't see that I did, and have politely asked if you would provide a link to that duplicate post
I'll wait for August its bound to be hotter again, we even had some nice sunny weather here in Vic during August, that should add about .2c to the global record
GenghisKush
Well-known member
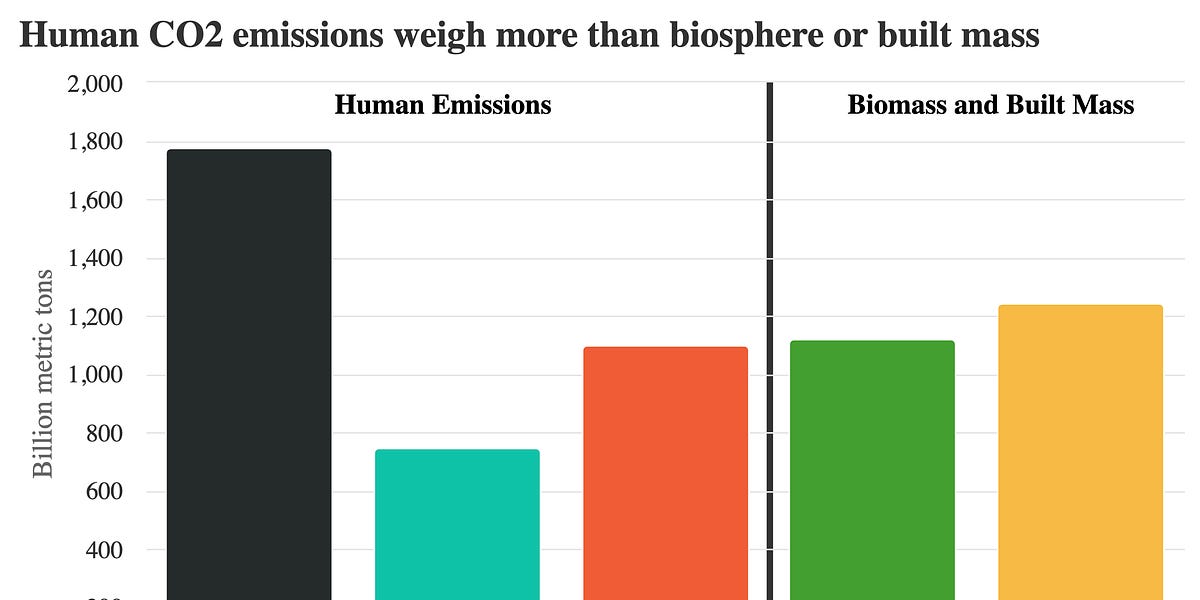
The staggering scale of human CO2 emissions
We've emitted more CO2 than all living biomass and human-made mass combined.
ZEKE HAUSFATHER
JUL 10, 2023
Human activities – burning fossil fuels and cutting down forest – currently emit around 40 billion tons of CO2 per year. But what does that actually mean? How big are our carbon emissions actually?
Comparing our emissions to big things
Forty billion tons (also called gigatons) is an enormous large number. Its about 50 times the weight of all the cars in the world, for example, or the weight of 800,000 Titanic-sized ships.However, one year’s emissions only tells a small part of the story. We build and sell new cars each year, but the amount of cars on the road is much larger than any individual year’s sales. Similarly, CO2 that we emit accumulates in the atmosphere, such that the amount of warming the world experiences is a result of our cumulative emissions over time rather than a single year’s emissions.
Since the mid-1700s, humans have emitted approximately 2.5 trillion tons of CO2, with around 1,770 billion tons from burning fossil fuels and around 750 billion tons from land use change. About 44% of this – around 1,100 tons – has accumulated in the atmosphere, while the remaining 56% has been absorbed by the land and oceans.
The 2.5 trillion tons of CO2 we have emitted from both fossil fuels and land use change is larger than the total dry living biomass (e.g. all living things on the planet today) and the mass of all human-made structures (all concrete, brick, steel, etc.), as shown in the figure below. If we look at just carbon emissions (keeping in mind that the O2 adds a lot of the mass of CO2), this would translate to around 688 billion tons of carbon.
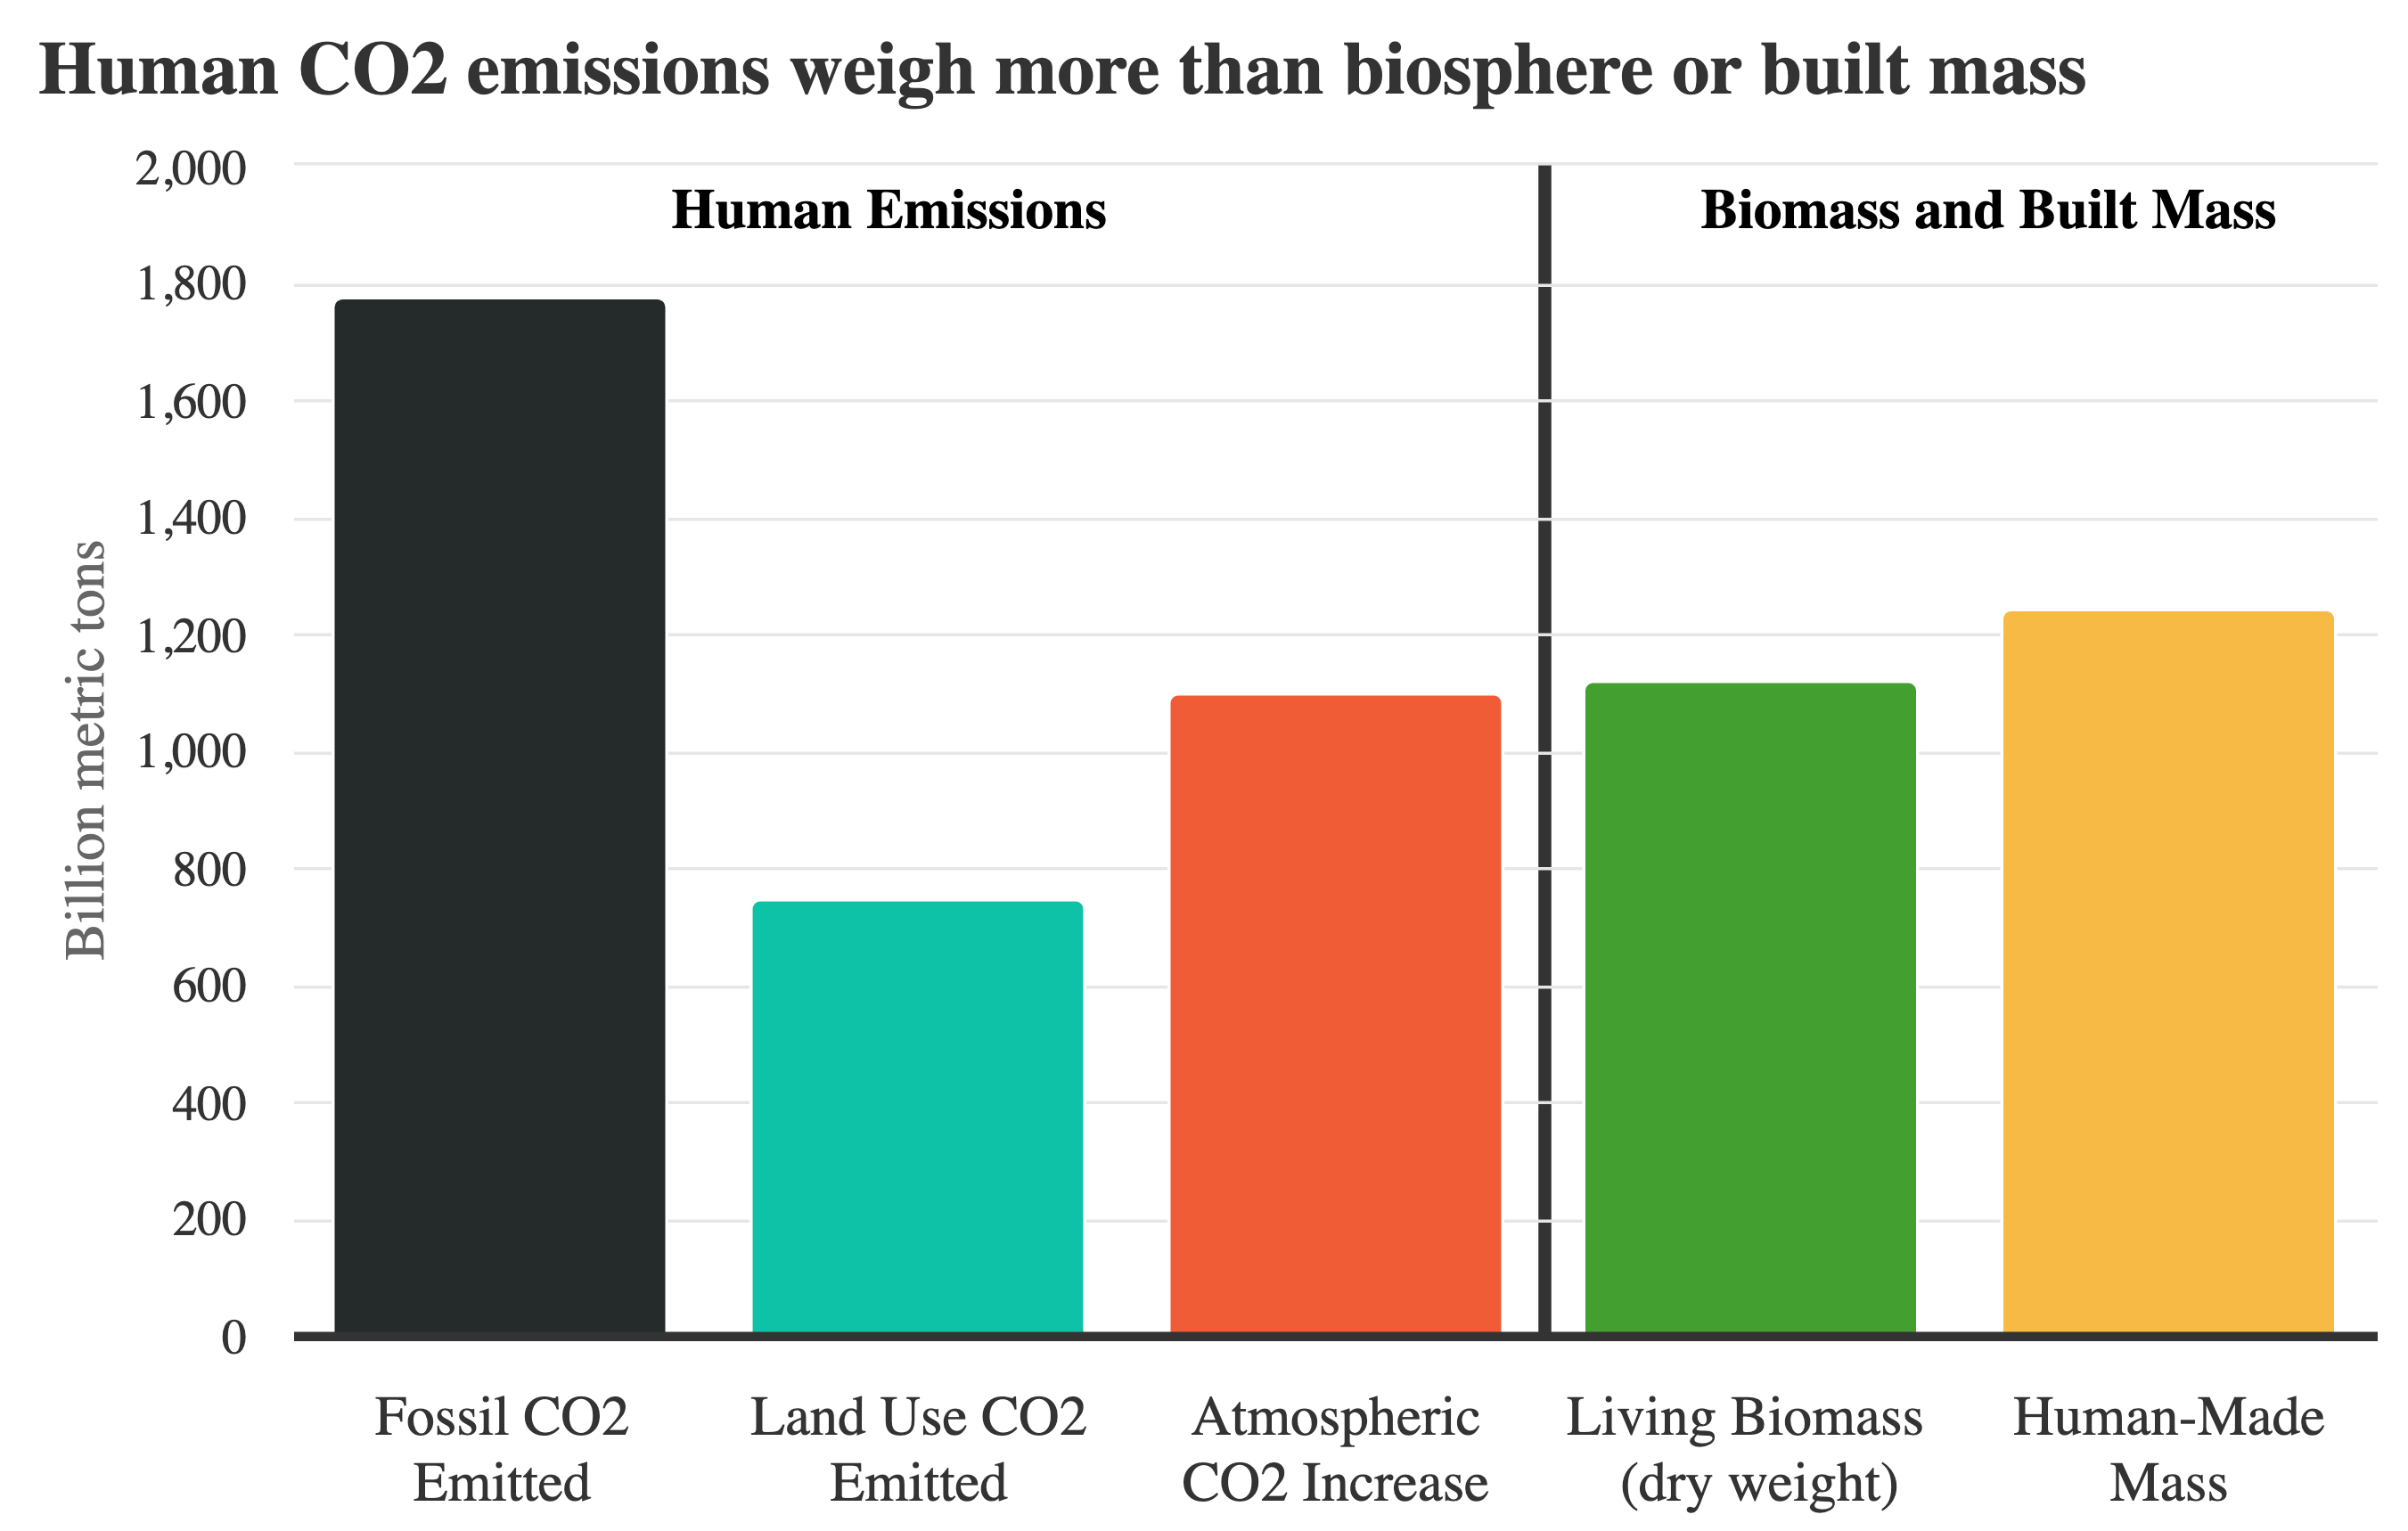
Cumulative global emissions of CO2 from fossil fuels and land use and atmospheric accumulation from 1750 based on data from the Global Carbon Project. Data on living biomass and human-made mass from Elhacham et al 2020.
The fact that a bit more than half of our emissions are removed by land and ocean “carbon sinks” is a good thing; we would have roughly twice as much climate change to date if we didn’t have these sinks lending us a hand. Unfortunately, the more we emit CO2, the less effective we expect these sinks to become. Under higher emissions scenarios we’d expect more of our emissions to remain in the atmosphere, as shown in the figure below.

IPCC AR6 WG1 Figure SPM.7
Using data on emissions and sinks over time, scientists have created a “global carbon budget” showing where emissions come from and end up. The figure below shows both fossil fuel (grey) and land use (yellow) emissions, as well as ocean (dark blue), land (green), and atmospheric (light blue) sinks.

Global Carbon Budget, 1959-2022. Figure from Carbon Brief’s analysis of the 2022 Global Carbon Budget.
The amount that ends up in the atmosphere accumulates over time, with the sum of all the light blue in this graph representing the total increase in atmospheric CO2 since 1959.

Atmospheric CO2 concentrations from over the past 10,000 years. Figure from Berkeley Earth.
Human emissions of CO2 since the industrial revolution have increased the amount of CO2 in the Earth’s atmosphere by 50%, from 280 to 420 parts per million. This represents a geoengineering of the planet on a staggering scale, and has resulted in the planet warming between 1.1C and 1.3C over the past 170 years.

Global mean surface temperatures from various scientific groups. Figure from the World Meteorological Organization’s State of the Global Climate in 2022 report.
The staggering scale of human CO2 emissions
We've emitted more CO2 than all living biomass and human-made mass combined.
 www.theclimatebrink.com
"Marine prokaryotes grow extremely fast – a process that emits a lot of carbon. In fact, prokaryotes to an ocean depth of 200 metres produce about 20 billion tonnes of carbon a year: double that of humans."
Maybe all the climate scientists could get together and decide how many tons of Co2 we humans produce
40 billion tons a year in the post above and 10 billion in the article below.
It's a climate change clown show
 theconversation.com
Maybe all the climate scientists could get together and decide how many tons of Co2 we humans produce
40 billion tons a year in the post above and 10 billion in the article below.
It's a climate change clown show
Earth’s oldest, tiniest creatures are poised to be climate change winners – and the repercussions could be huge
The rise of ‘pyrokaryotes’ could reduce the availability of fish humans eat, and hamper the ocean’s ability to absorb carbon emissions.
95 % of graphs and statistics are made up. including this one ."Marine prokaryotes grow extremely fast – a process that emits a lot of carbon. In fact, prokaryotes to an ocean depth of 200 metres produce about 20 billion tonnes of carbon a year: double that of humans."
Maybe all the climate scientists could get together and decide how many tons of Co2 we humans produce
40 billion tons a year in the post above and 10 billion in the article below.
It's a climate change clown show
Earth’s oldest, tiniest creatures are poised to be climate change winners – and the repercussions could be huge
The rise of ‘pyrokaryotes’ could reduce the availability of fish humans eat, and hamper the ocean’s ability to absorb carbon emissions.
they love a graph and a pie chart
Porky82
Well-known member
You're definitely the one to know!95 % of graphs and statistics are made up. including this one .
they love a graph and a pie chart
you don't believe its accurate ?
You have been making a fool of ya self today haven't ya.Rubbish, the margin of error would be huge and not at all reliable enough to claim anything

it's NOT just today, you know...You have been making a fool of ya self today haven't ya.

