What's new
  • As of today ICMag has his own Discord server. In this Discord server you can chat, talk with eachother, listen to music, share stories and pictures...and much more. Join now and let's grow together! Join ICMag Discord here! More details in this thread here: here.

Have you looked at the North Pole lately?

igrowone

Well-known member
Veteran
As Arctic Ice Melts, Polluting Ships Stream Into Polar Waters

August 28, 2020 by Reuters

By Jonathan Saul LONDON, Aug 28 (Reuters) – As melting sea ice opens the Arctic to navigation, more ships are plying the loosely regulated polar waters, bringing increasing amounts of climate-warming pollution, a Reuters analysis of new shipping and fuel-consumption data shows.

Traffic through the icy region’s busiest lane along the Siberian coast increased 58% between 2016 and 2019. Last year, ships made 2,694 voyages on the Northern Sea Route, according to data collected by researchers from the Centre for High North Logistics at Norway’s Nord University.

The trade is driven by commodities producers – mainly in Russia, China and Canada – sending iron ore, oil, liquefied natural gas (LNG) and other fuels through Arctic waters.

Even the COVID-19 pandemic, which has significantly slowed shipping worldwide as supply chains have been disrupted, has not prevented traffic increasing on the Arctic artery. Ships made 935 voyages in the first half of 2020, up to the end of June, compared with 855 in the same period last year, the data shows.

The increase in shipping is a worry for the environment. As those heavy ships burn fuel, they release climate-warming carbon dioxide as well as black soot. That soot blankets nearby ice and snow, absorbing solar radiation rather than reflecting it back out of the atmosphere, which exacerbates warming in the region.

The Arctic has already warmed at least twice as fast as the rest of the world over the last three decades. With the region’s warming rate increasing in recent years, governments are gearing up for a future of open Arctic waters.

“The driving concern is the reduction of Arctic sea ice and the potential for more shipping,” said Sian Prior, lead adviser with the Clean Arctic Alliance. “We are already seeing that happen.”

LNG tankers make up the largest proportion of traffic on the Northern Sea Route. They alone burned 239,000 tonnes of fuel in 2019, versus only 6,000 tonnes in 2017, according to previously unpublished data collected by the non-profit International Council on Clean Transportation and shared with Reuters.

EARLIEST THAW ON RECORD

The Northern Sea Route, which traces the coasts of Siberia and Norway, is the region’s busiest artery. It allows cargo ships to save at least 10 days sailing between Europe and Asia, shipping specialists estimate.

The route is about 6,000 nautical miles shorter than sailing via Africa, and 2,700 nautical miles shorter than sailing through the Suez Canal.

That shortcut drew ships to make the 2,694 voyages in 2019, up from 2,022 in 2018, 1,908 in 2017 and 1,705 in 2016, according to Nord University’s Centre for High North Logistics. Those trips are made each year by just 200-300 ships.

This year, unusually warm weather over northern Russia caused an early retreat of sea ice from Siberia.

That heatwave, which scientists have linked to climate change, had opened up the Northern Sea Route by the second half of July, marking the earliest complete thaw of that area yet recorded, scientists at the University of Colorado Boulder’s National Snow and Ice Data Center say.

As summertime heat shrinks the sea ice further, traffic is expected to become even heavier.

Last year, September was the region’s busiest month in terms of the number of ships navigating the route, with 34 vessels passing though compared with 29 in August, according to data from shipping intelligence platform MarineTraffic.

Traffic beyond the Northern Sea Route is also rising.

A total of 1,628 ships entered the Arctic region, outside that route, in 2019, up 25% from 2013, a study by the intergovernmental Arctic Council working group showed.

“We have seen constant growth (in shipping) over the last several years,” said Kjell Stokvik, managing director of the Centre for High North Logistics at Nord University. This trend will continue as long as there is demand for fuel and mineral cargoes across the global market, he added.

Russia in particular is driving trade through the region by developing energy and mineral projects in the Arctic, Stokvik said. President Vladimir Putin has set a target of transporting 80 million tonnes of cargo annually via the Northern Sea Route by 2025, more than twice what it ships today.

A TALE OF TWO POLES

Also of concern for environmentalists is the risk of fuel spills in Arctic waters, where the harsh conditions make cleanup efforts especially challenging and spills could have devastating impacts on sensitive ecosystems.

The 1989 crude oil spill by the Exxon Valdez tanker off southern Alaska spread out for months over 1,300 miles (2,100 km) of coastal wilderness, killing marine animals and plants throughout Prince William Sound.

The accident, considered one of the worst human-caused environmental disasters, led to new rules requiring double-hulled ships in the region.

But while Antarctic waters are protected by stringent regulations, including a ban on heavy-grade oil adopted in 2011 – despite no cargo moving through those turbulent southern waters – the rules for sailing the Arctic are far looser.

Waters at both poles are governed by the International Maritime Organization’s (IMO) Polar Code, and ships are “encouraged” to avoid using or carrying heavy fuel oil in the Arctic.

The IMO is pushing for a full ban on both the use and carriage of heavy fuel oil through the Arctic by 2024. “The approach is to take action to mitigate any potential negative (environmental) impact,” an IMO spokeswoman told Reuters.

Environmentalists note, however, that the draft rules being negotiated by member states currently include a clause to exempt ships flagged to countries with Arctic coastlines while operating in those waters until 2029.

That exemption would end up applying to some of today’s most active Arctic shippers, including Russia and Canada. Such “big loopholes” would make the regulation “virtually meaningless,” said Prior, of the Clean Arctic Alliance.

“A significant amount – probably three-quarters or more – of the shipping currently using the Arctic will not need to apply the ban until July 1, 2029, if it remains as currently drafted,” Prior said.

When asked about whether such exceptions would undermine the proposed regulation, the IMO spokeswoman said: “These are decisions made by the member states following discussion in the relevant fora.”
 

trichrider

Kiss My Ring
Veteran
https://www.youtube.com/watch?v=OBzHyOn7kkY
[YOUTUBEIF]OBzHyOn7kkY[/YOUTUBEIF]
Warm Arctic, Cold Siberia Pattern: Role of Full Arctic Amplification Versus Sea Ice Loss Alone

https://agupubs.onlinelibrary.wiley.com/doi/10.1029/2020GL088583

WACCM simulations: Decadal winter-to-spring climate impact on middle atmosphere and troposphere from medium energy electron precipitation
Highlights

•Sub-polar O3 depletion by NOx perturb zonally asymmetric O3 and short wave heating and thereby planetary wave (PW) driving.
•The reduced PW forcing strengthens the polar vortices in early winter, while the SH polar vortex is weakened in late winter.
•Vertical dipoles in temperatures are induced at high latitudes by dynamically induced anomalous mean meridional circulations.
•The early (late) winter dynamical changes migrate downward into the troposphere in NH (SH).


Abstract

Energetic particle precipitation is one of the main processes by which the sun influences atmospheric composition and structure. The polar middle atmosphere is chemically disturbed by the precipitation-induced production of nitric oxides (NOx) and hydrogen oxides (HOx) and the associated ozone (O3) loss, but the importance for the dynamics is still debated. The role of precipitating medium energy electrons (MEEs), which are able to penetrate into the mesosphere, has received increased attention, but has only recently begun to be incorporated in chemistry-climate models. We use the NCAR Whole Atmosphere Community Climate Model (WACCM) to study the climate impact from MEE precipitation by performing two idealized ensemble experiments under pre-industrial conditions, with and without the MEE forcing, over the period of the solar cycle 23 (only full calendar years, 1997–2007). Each experiment includes 20 11-year ensemble members, total 220 years. Our results indicate a strong month-to-month variability in the dynamical response to MEE throughout the winter period. We find a strengthening of the polar vortex in the northern hemisphere during December, but the signal decays rapidly in the following months. The polar vortex strengthening is likely attributable to planetary wave reduction due to increased zonal symmetries in upper stratospheric ozone heating, initially triggered by MEE-induced NOx advected into the sunlit regions. We also find a similar early winter polar vortex strengthening in the southern hemisphere during June. Changes in mean meridional circulation accompany these anomalous wave forcings, leading to dynamically-induced vertical temperature dipoles at high latitudes. The associated weakening of the stratospheric mean meridional circulation results in an upper stratospheric polar ozone deficit in early winter. This polar cap ozone deficit is strongest in the southern hemisphere and contributes to a polar vortex weakening in late winter, in concert with increased planetary wave forcing. In both hemispheres, the stratospheric polar vortex signal seems to migrate downwards into the troposphere and to the surface.


https://www.sciencedirect.com/science/article/pii/S1364682620301930


In Nature Climate Change paper, researchers say the world needs to consider tradeoffs of untested technologies before dismissing known options such as immediate carbon emissions reductions.

https://engineering.virginia.edu/ne...-don’t-bet-it-examining-costs-researchers-say


Club Of Rome Declares Planetary Emergency Plan – It’s Not Good For Liberty!

The following is a partial text from the above plan.
For 10,000 years, human civilisation has grown and thrived because of Earth’s remarkable climate stability and rich biological diversity. In the last 50 years, human activity has severly undermined this resilience. Our patterns of economic growth, development, production and consumption are pushing the Earth’s life-support systems beyond their natural boundaries. The stability of these systems – our global commons on which we so fundamentally depend – is now at risk. The science is clear that we are now accelerating towards tipping points and that the consequences of inaction will be catastrophic for humanity. The time to act is running out.
This is a Planetary Emergency. The definition of an emergency is a dangerous event requiring immediate action to reduce risk of potentially catastrophic results. The impacts of climate change and ecological destruction are more severe and are manifesting themselves earlier than many scientific predictions in previous decades had foreseen. The most authoritative global scientific assessments conclude that without major interventions, the risks will soon reach a critical stage. We need to stabilise the climate at 1.5°C above pre-industrial temperatures, halt the loss of biodiversity, slow polar ice sheet melt and glacier retreat, protect critical biomes and store more carbon in soils, forests and oceans. This is how we will guarantee the longterm health and well-being of both people and planet. To do that, however, our response to this complex emergency must reflect the intricate links between life on our planet and the systems that regulate it. It must address the convergence of crises and tipping points which have created this Planetary Emergency. We have no more time for incremental, siloed policy action.
2020 is a “Super Year” for international policy action. It is the 75th anniversary of the United Nations. It is the first opportunity for nations to increase climate ambition and meet 2050 net-zero goals. A new treaty on the oceans will be agreed. Biodiversity targets will be announced. And 2020 will mark the beginning of the decade to scale action to achieve the Sustainable Development Goals. This decade must be a turning point, the moment when the world bends the curve, averts the impending disaster and opts instead to embark on the fastest economic transformation in our history. Declaring a Planetary Emergency provides a new compass for nations and injects the essential urgency into decision-making. It will ensure that all action from 2020 will be taken in light of its impact on the stability of Earth’s life-support systems, and be underpinned by the social and economic transformations needed to secure the long-term health and well-being of people and planet. While our efforts should be global, our responses must be local. They should be tailored to local needs, resources and cultures to ensure they have maximum impact and work to everyone’s advantage.
The existential risk is real. Yet, the opportunities to not just avert disaster but to rebuild, improve and regenerate are readily available. History has shown that humanity is remarkably resilient. We are well adapted to respond to disaster through cooperation and innovation. But the potential consequences we face this time are different – we have a narrow window to act now to reduce risk or avoid catastrophe. We don’t know how to reconstruct the cryosphere, the hydrological cycle, the rainforests, coral reefs and all other life-support systems on Earth. Once the emergency fully manifests itself, it will simply be too late to reverse the breakdown. As well as halting climate change and protecting nature, these efforts will improve health, livelihoods and equity and create more liveable and sustainable cities and rural communities.
Our proposed commitments and underpinning action are of the scale needed to respond to the emergency facing people and planet. Our aim is to protect the Global Commons through 10 clear commitments, and ensure they are met by immediately implementing a set of transformational policy and market levers. This is our insurance policy to emerge from emergency and guarantee a just transition for all.
We invite nations to discuss the case for a Planetary Emergency Plan. We propose such a plan be founded on the urgent need to halve greenhouse gas emissions by 2030, to reach carbon-neutrality by 2050, while halting biodiversity loss and protecting essential Global Commons. Such an initiative is consistent with the Sustainable Development Goals to end poverty and improve quality of life. We can emerge from emergency to a world which benefits all species, within planetary boundaries and leaving no one behind. This is the world we envisage, and the world to which we must all aspire.
The Rationale For Emergency Action

The science is clear: the climate and biodiversity are fully integrated and interdependent. Every year since the Industrial Revolution, land-based and ocean ecosystems have absorbed close to half of all emissions from fossil-fuel burning. Without nature’s ability to absorb and store our GHG emissions, we would have already exceeded 2°C of warming, with potentially disastrous consequences. Breaching this threshold of warming could push the planet towards irreversible and catastrophic biosphere feedbacks
When climate change alters a chink in the planetary system, it can set off a chain of negative feedback loops. Increasing droughts, for instance, are reducing the ability of tropical forests to store carbon, making them more prone to fires, releasing yet more GHG emissions. The significant loss of the Cryosphere has reduced the albedo capacity of key Earth systems to reflect heat away from the planet. The higher the temperature, the more permafrost thaws, with greater emissions of both CO2 and methane, leading to even greater warming and triggering further negative feedback loops.
At least one million species risk disappearance, many within decades7 . Food chains could disintegrate and vital ecosystems collapse. Species diversity and ecosystems integrity play a fundamental role in regulating the climate, water cycles, carbon sequestration and food production.


https://clubofrome.org/wp-content/uploads/2020/02/PlanetaryEmergencyPlan_CoR-4.pdf


:wave:
 

St. Phatty

Active member
i'm sure some idiot is contemplating causing one...

it's kind of a group effort.

Thousands of millionaires flying private jets around the nation, consuming enough gasoline for 10 or 100 trucks.


Maybe the die was cast, for the Climate change version of nuclear winter, when the US tore down all their mass transit.
 

igrowone

Well-known member
Veteran
time for ice melting excitement
will a new minimum be set? hard to call at the moment
this is how the NSIDC is framing it

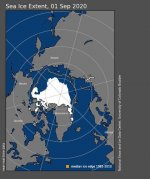
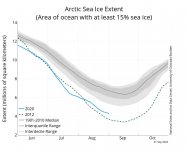
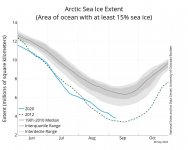
After a period of rapid sea ice loss extending into the last week of August, the rate has slowed with the onset of autumn in the Arctic. A region of low concentration ice persists in the Beaufort Sea. How much of this ice melts over in the next two weeks will strongly determine where the September sea ice minimum will stand in the record books. The Northwest Passage (Amundsen’s route) is largely open but some ice remains. The Northern Sea Route, along the Siberian coast, remains open.
 

Attachments

  • N_daily_extent.jpg
    N_daily_extent.jpg
    30.6 KB · Views: 33
  • N_iqr_timeseries.jpg
    N_iqr_timeseries.jpg
    52.1 KB · Views: 33

trichrider

Kiss My Ring
Veteran
https://ocean.dmi.dk/arctic/icethickness/images/FullSize_CICE_combine_thick_SM_EN_20200903.png


starting to gain ice again...still some 4 meters thick.


Study: Models underestimate amount of carbon absorbed by Earth’s oceans

study-models-underestimate-amount-of-carbon-absorbed-by-earth-oceans-nasa-cloud-forms.jpg
UPI4 Sep 2020152
Sept. 4 (UPI) — Some parts of the ocean are absorbing carbon at the twice the rate predicted by current climate models, according to a new study published Friday in the journal Nature Communications.
The movement of carbon between ocean and atmosphere is called carbon flux. New research suggests models designed to predict carbon flux have ignored the influence of small temperature differences between the ocean surface and a few feet below.
“Those differences are important because carbon dioxide solubility depends very strongly on temperature,” lead study author Andrew Watson said in a news release.
For the past few decades, researchers have been collecting a massive database of near-surface carbon dioxide measurements across the planet’s oceans, the so-called Surface Ocean Carbon Atlas. The measurements can be used to calculate carbon flux, but until now, scientists have been incorrectly ignoring surface and near-surface temperatures.
“We used satellite data to correct for these temperature differences, and when we do that it makes a big difference — we get a substantially larger flux going into the ocean,” said Watson, a professor at the University of Exeter’s Global Systems Institute. “The difference in ocean uptake we calculate amounts to about 10 percent of global fossil fuel emissions.”
When researchers accounted for surface and near-surface temperatures, they found their carbon flux predictions aligned more closely with the results of an independent method of calculating carbon uptake in Earth’s oceans.
“That method makes use of a global ocean survey by research ships over decades, to calculate how the inventory of carbon in the ocean has increased,” said co-author Jamie Shutler, researcher at Exeter’s Center for Geography. “These two ‘big data’ estimates of the ocean sink for CO2 now agree pretty well, which gives us added confidence in them.”
While carbon uptake by the planet’s oceans can help slow the greenhouse gas effect, excess carbon has a variety of negative consequences for marine ecosystems. As CO2 levels in the ocean increase, ocean water becomes more acidic.
Ocean acidification is a serious threat to species that built calcium carbonate skeletons and shells, including mollusks, sea urchins, starfish and corals. Recent studies suggest the problem is likely to get worse in the coming decades.


https://www.nature.com/articles/s41467-020-18203-3


Revised estimates of ocean-atmosphere CO2 flux are consistent with ocean carbon inventory


  • Andrew J. Watson,
  • Ute Schuster,
  • Jamie D. Shutler,
  • Thomas Holding,
  • Ian G. C. Ashton,
  • Peter Landschützer,
  • David K. Woolf &
  • Lonneke Goddijn-Murphy
Nature Communications volume 11, Article number: 4422 (2020) Cite this article


Abstract

The ocean is a sink for ~25% of the atmospheric CO2 emitted by human activities, an amount in excess of 2 petagrams of carbon per year (PgC?yr?1). Time-resolved estimates of global ocean-atmosphere CO2 flux provide an important constraint on the global carbon budget. However, previous estimates of this flux, derived from surface ocean CO2 concentrations, have not corrected the data for temperature gradients between the surface and sampling at a few meters depth, or for the effect of the cool ocean surface skin. Here we calculate a time history of ocean-atmosphere CO2 fluxes from 1992 to 2018, corrected for these effects. These increase the calculated net flux into the oceans by 0.8–0.9 ?PgC yr?1, at times doubling uncorrected values. We estimate uncertainties using multiple interpolation methods, finding convergent results for fluxes globally after 2000, or over the Northern Hemisphere throughout the period. Our corrections reconcile surface uptake with independent estimates of the increase in ocean CO2 inventory, and suggest most ocean models underestimate uptake.

full paper here:
https://www.nature.com/articles/s41467-020-18203-3
 
https://ocean.dmi.dk/arctic/icethickness/images/FullSize_CICE_combine_thick_SM_EN_20200903.png


starting to gain ice again...still some 4 meters thick.


Study: Models underestimate amount of carbon absorbed by Earth’s oceans

View ImageUPI4 Sep 2020152
Sept. 4 (UPI) — Some parts of the ocean are absorbing carbon at the twice the rate predicted by current climate models, according to a new study published Friday in the journal Nature Communications.
The movement of carbon between ocean and atmosphere is called carbon flux. New research suggests models designed to predict carbon flux have ignored the influence of small temperature differences between the ocean surface and a few feet below.
“Those differences are important because carbon dioxide solubility depends very strongly on temperature,” lead study author Andrew Watson said in a news release.
For the past few decades, researchers have been collecting a massive database of near-surface carbon dioxide measurements across the planet’s oceans, the so-called Surface Ocean Carbon Atlas. The measurements can be used to calculate carbon flux, but until now, scientists have been incorrectly ignoring surface and near-surface temperatures.
“We used satellite data to correct for these temperature differences, and when we do that it makes a big difference — we get a substantially larger flux going into the ocean,” said Watson, a professor at the University of Exeter’s Global Systems Institute. “The difference in ocean uptake we calculate amounts to about 10 percent of global fossil fuel emissions.”
When researchers accounted for surface and near-surface temperatures, they found their carbon flux predictions aligned more closely with the results of an independent method of calculating carbon uptake in Earth’s oceans.
“That method makes use of a global ocean survey by research ships over decades, to calculate how the inventory of carbon in the ocean has increased,” said co-author Jamie Shutler, researcher at Exeter’s Center for Geography. “These two ‘big data’ estimates of the ocean sink for CO2 now agree pretty well, which gives us added confidence in them.”
While carbon uptake by the planet’s oceans can help slow the greenhouse gas effect, excess carbon has a variety of negative consequences for marine ecosystems. As CO2 levels in the ocean increase, ocean water becomes more acidic.
Ocean acidification is a serious threat to species that built calcium carbonate skeletons and shells, including mollusks, sea urchins, starfish and corals. Recent studies suggest the problem is likely to get worse in the coming decades.


https://www.nature.com/articles/s41467-020-18203-3


Revised estimates of ocean-atmosphere CO2 flux are consistent with ocean carbon inventory


  • Andrew J. Watson,
  • Ute Schuster,
  • Jamie D. Shutler,
  • Thomas Holding,
  • Ian G. C. Ashton,
  • Peter Landschützer,
  • David K. Woolf &
  • Lonneke Goddijn-Murphy
Nature Communications volume 11, Article number: 4422 (2020) Cite this article


Abstract

The ocean is a sink for ~25% of the atmospheric CO2 emitted by human activities, an amount in excess of 2 petagrams of carbon per year (PgC?yr?1). Time-resolved estimates of global ocean-atmosphere CO2 flux provide an important constraint on the global carbon budget. However, previous estimates of this flux, derived from surface ocean CO2 concentrations, have not corrected the data for temperature gradients between the surface and sampling at a few meters depth, or for the effect of the cool ocean surface skin. Here we calculate a time history of ocean-atmosphere CO2 fluxes from 1992 to 2018, corrected for these effects. These increase the calculated net flux into the oceans by 0.8–0.9 ?PgC yr?1, at times doubling uncorrected values. We estimate uncertainties using multiple interpolation methods, finding convergent results for fluxes globally after 2000, or over the Northern Hemisphere throughout the period. Our corrections reconcile surface uptake with independent estimates of the increase in ocean CO2 inventory, and suggest most ocean models underestimate uptake.

full paper here:
https://www.nature.com/articles/s41467-020-18203-3


So what you're saying is the ocean is acidifying at twice the rate that we thought.
 

igrowone

Well-known member
Veteran
the 2020 saga continues
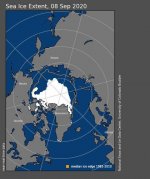
nearing the record lows of 2012, either it will be a new record or close
the ice continues to shrink at the at the arctic
it's real and happening NOW
 

Attachments

  • N_daily_extent.jpg
    N_daily_extent.jpg
    30.6 KB · Views: 32
  • N_iqr_timeseries.jpg
    N_iqr_timeseries.jpg
    52.4 KB · Views: 34

St. Phatty

Active member
attachment.php


if 3 of the 4 largest fires in California history all occurred in the present year - and are still burning - does that count as an example of climate change ?

attachment.php


Chem - Apollo 11 seedling with a tiny piece of ash from the local fires.


It's coming out in the news that one of the most impactful fires in Oregon, the one that burned a five mile long strip of mobile home parks in Phoenix and Talent, may have been arson.

https://www.statesmanjournal.com/st...nix-talent-jackson-county-ashland/5756018002/

https://www.oregonlive.com/crime/20...und-at-almeda-fire-in-ashland-chief-says.html

Not sure how the arson fits in with climate change.
 

Attachments

  • IMG_20200910_070435_chem+ash.jpg
    IMG_20200910_070435_chem+ash.jpg
    72.4 KB · Views: 28
  • ca-fire.jpg
    ca-fire.jpg
    105.8 KB · Views: 32

igrowone

Well-known member
Veteran
View Image

if 3 of the 4 largest fires in California history all occurred in the present year - and are still burning - does that count as an example of climate change ?
...
Not sure how the arson fits in with climate change.
information that shouldn't be ignored
a warming world will tend to increase conditions of dryness if precipitation doesn't increase
is it an airtight case in and of itself? it's more complicated than a simple yes/no
but the balance of evidence is simply beyond reasonable doubt
will it become dramatically worse than now? that is the fear
 

St. Phatty

Active member
information that shouldn't be ignored
a warming world will tend to increase conditions of dryness if precipitation doesn't increase
is it an airtight case in and of itself? it's more complicated than a simple yes/no
but the balance of evidence is simply beyond reasonable doubt
will it become dramatically worse than now? that is the fear

the 'airtight' part is the CO2 increase, from 350 ppm to the current 415 ppm.

Of course these are numbers that are GREAT for growing pot.

In the "old days", grow books recommended 389 parts per million for CO2 supplementation, in Cannabis grow-ops. Referring to an Ed Rosenthal book.

Vegetation with CO2 supplementation grows Mucho de Vigorous - until it runs out of water.

For sure, the extra fuel that is part of these fires, is related to the CO2.

Having experienced windy weather all my life, I don't think the 2 days of wind is that strange. It just happened to occur while they already had some fires going. In California from the Lightning, a few weeks ago.

So it's just normal old weather, a "wind event" about 4 weeks after a "Lightning Event".

Mendocino is getting hammered about the worst.

https://inciweb.nwcg.gov/incident/6983/

It's on its way to being 500,000 acres. I think of Mendocino as being the Heart of California - not Hollywood.


And, to add a touch of the Macabre, the fire that burned all the mobile homes in Southwest Oregon, is being described as Arson related to the presence of a Dead Body, which they are afraid to describe as a Suicide.
 

trichrider

Kiss My Ring
Veteran
Climate at a Glance: U.S. Wildfires

wildfire_87972415_s.jpg
Burning pine forest in the Western United States. Image licensed from 123RF View this page as a printable PDF:
CAAG-US-western-wildfiresDownload
Bullet-Point Summary:

  • Wildfires are far less frequent and severe than was the case throughout the first half of the 20th century.
  • Occasional upticks in current wildfire activity still result in far less land burnt than was the case throughout the 20th century.
  • Even the worst recent wildfire years burned only 1/5th to 1/2 as much land as typical wildfire years during the early 20th century.
  • Drought is the key climate factor for wildfires. As shown in Climate at a Glance: Drought, the United States in recent decades is benefiting from strikingly small amounts of drought.
Short Summary: Wildfires, especially in arid parts of the United States, have always been a natural part of the environment and likely always will. Global warming did not create wildfires. In fact, wildfires have become less frequent and less severe in recent decades.
The U.S. National Interagency Fire Center reports data on U.S. wildfires back as far as 1926. The Fire Center data show the numbers of acres burned is far less now than it was throughout the early 20th century, 100 years of global warming ago. See Figure 1, below. Current acres burned run about 1/4th to 1/5th of the record values which occurred in the 1930s. At that time, the peak wildfire burn was over 52 million acres. In the decade since 2010, the peaks have been 10 million acres or less.
Figure 1: Total wildfire acreage burned by year in the United States, 1926 to 2019. Data from https://www.nifc.gov/fireInfo/fireInfo_stats_totalFires.html
Graph by meteorologist Anthony Watts Climate alarmists sometimes cite a very small upwards trend since 1983 to suggest that climate change has been making wildfires worse in the USA. However, that is cherry-picking a very minor trend compared to the complete picture.
 

St. Phatty

Active member
Climate at a Glance: U.S. Wildfires

View ImageBurning pine forest in the Western United States. Image licensed from 123RF View this page as a printable PDF:


The more data the better.

Would sure like to know what the history is of wind in Oregon in September & October.

They're talking about this like it's some EXTREME weather event - and it's not.

It's 2 days of wind during a hot spell.


Now, probably related to the smoke, temps have dropped from the 100's to the 70's.

Silver Lining - I can slow down on watering all the plants.:dance: :kitty:


Anyway, I think Oregon is medium likely to have some more Wind Events, before the current fires are extinguished.

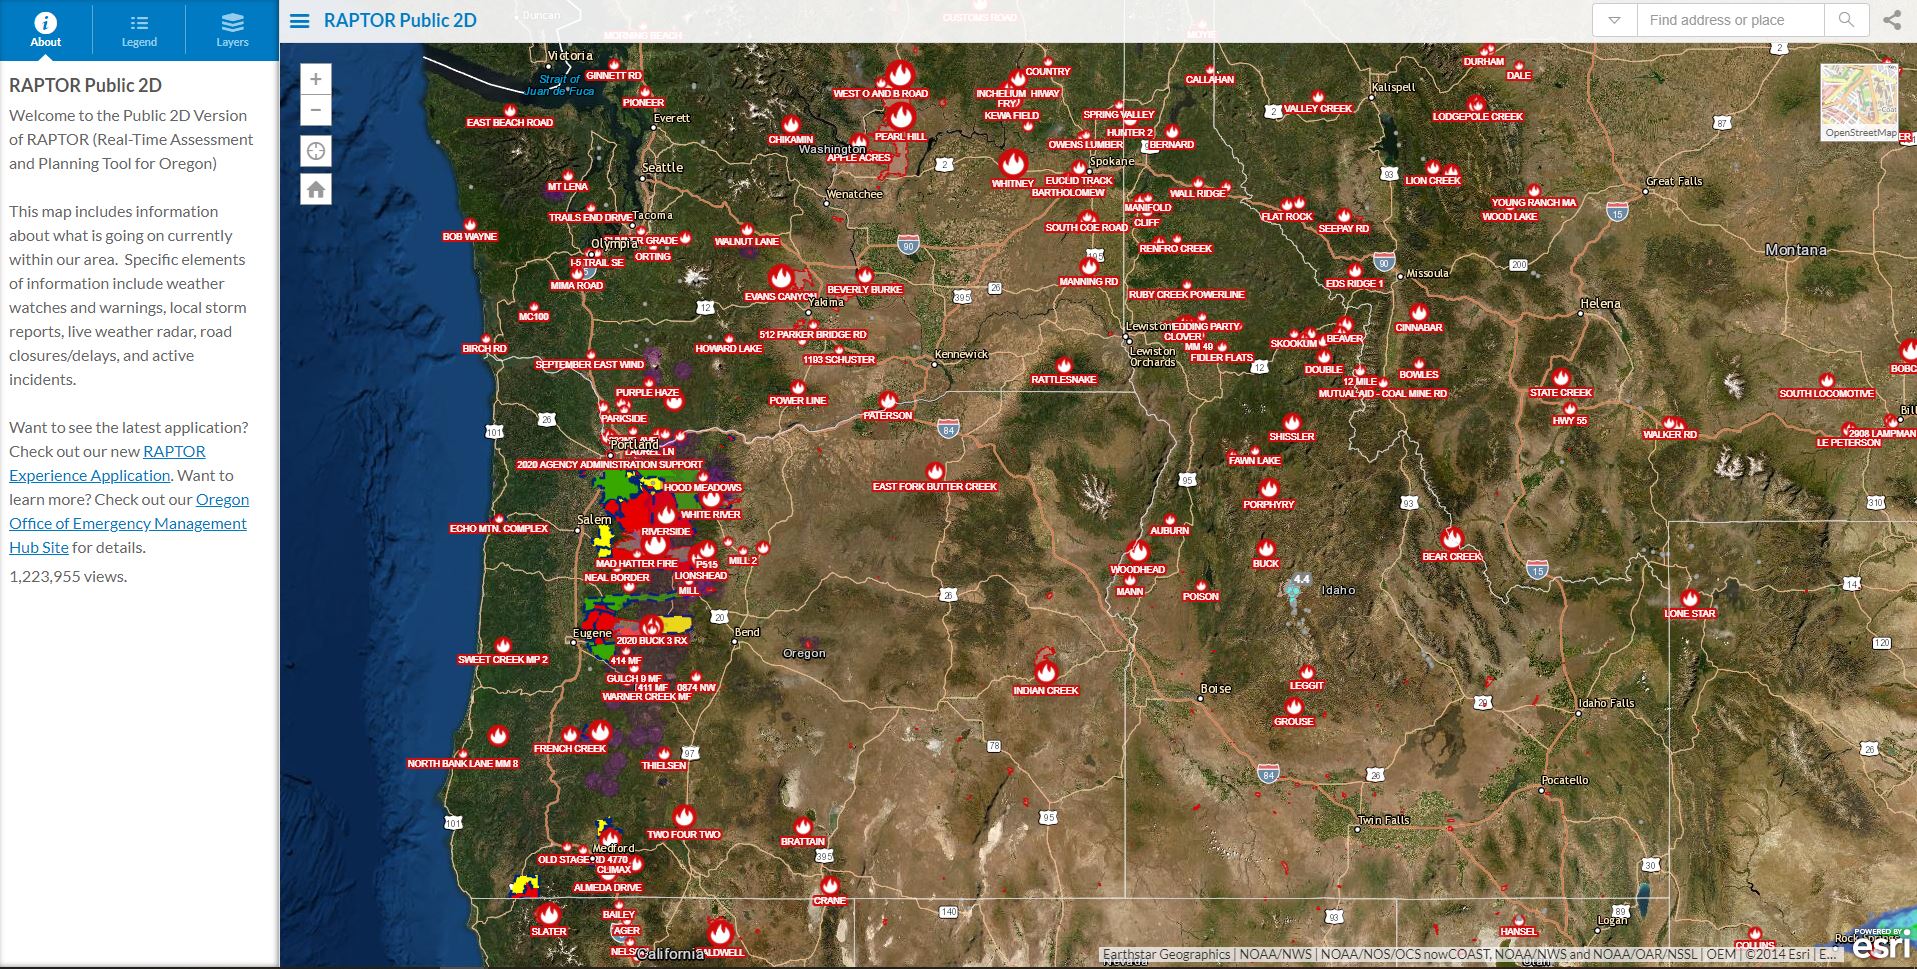
oregon-fire-map-sept-11.jpg


Almost, as if they were being punished by God for 3 months of rioting.

They're talking about the Beachie Creek fire MAYBE merging with the LionsHead fire ?!
 

St. Phatty

Active member
One more East Wind and the Portland suburbs will go Alberta.

Alberta had similar townhouse to townhouse fires in 2016.


I wonder if they use this as a selling point for steel frame building ?

What is the fire-proof replacement for OSB board and plywood ?
 

igrowone

Well-known member
Veteran
One more East Wind and the Portland suburbs will go Alberta.

Alberta had similar townhouse to townhouse fires in 2016.


I wonder if they use this as a selling point for steel frame building ?

What is the fire-proof replacement for OSB board and plywood ?

tweaked my interest
one could of course go pure masonry, steel reinforced concrete, maybe brick for the siding as the ultimate in fire resistance
but i do see fire resistant coatings for osb, and presumably for siding as well
water drip system for wetting roof and exterior walls?
new industry will be grown from tradgedy
 

St. Phatty

Active member
tweaked my interest
one could of course go pure masonry, steel reinforced concrete, maybe brick for the siding as the ultimate in fire resistance
but i do see fire resistant coatings for osb, and presumably for siding as well
water drip system for wetting roof and exterior walls?
new industry will be grown from tradgedy


how about Hemp mixed with natural earth materials like decomposed granite ?

It doesn't have to be completely non-flammable, it just has to be less flammable.
 

Latest posts

Latest posts

Top