What's new
  • As of today ICMag has his own Discord server. In this Discord server you can chat, talk with eachother, listen to music, share stories and pictures...and much more. Join now and let's grow together! Join ICMag Discord here! More details in this thread here: here.

Have you looked at the North Pole lately?

trichrider

Kiss My Ring
Veteran
Observations from 11 satellite missions monitoring the Greenland and Antarctic ice sheets have revealed that the regions are losing ice six times faster than they were in the 1990s. If the current melting trend continues, the regions will be on track to match the "worst-case" scenario of the Intergovernmental Panel on Climate Change (IPCC) of an extra 6.7 inches (17 centimeters) of sea level rise by 2100.

The findings, published online March 12 in the journal Nature from an international team of 89 polar scientists from 50 organizations, are the most comprehensive assessment to date of the changing ice sheets. The Ice Sheet Mass Balance Intercomparison Exercise team combined 26 surveys to calculate changes in the mass of the Greenland and Antarctic ice sheets between 1992 and 2018.

The assessment was supported by NASA and the European Space Agency. The surveys used measurements from satellites including NASA's Ice, Cloud, and land Elevation Satellite and the joint NASA-German Aerospace Center Gravity Recovery and Climate Experiment. Andrew Shepherd at the University of Leeds in England and Erik Ivins at NASA's Jet Propulsion Laboratory in Southern California led the study.

The team calculated that the two ice sheets together lost 81 billion tons per year in the 1990s, compared with 475 billion tons of ice per year in the 2010s—a sixfold increase. All total, Greenland and Antarctica have lost 6.4 trillion tons of ice since the 1990s.
show us the data, because you forgot the massive amount of ice gained in the same amount of time.
cyclical gains and loss do not prove global warming.
ffs, it's currently gaining mass or at least not losing anything...it was -51 F in the interior ten minutes ago when i looked.
just calling someone names won't dispute their work...and you're cherrypicking whatever you think supports the narrative of catastrophic warming even though nasa and noaa are using data that has been "optimized".
there is no "consensus" in science, not when even one disputes the settled science.
 

igrowone

Well-known member
Veteran
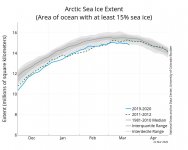
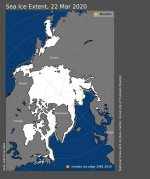
Spring has sprung in the Arctic?

Spring has sprung in the Arctic?

And time for a change of seasons, another freeze season in the arctic has ended.
My call here, official word will arrive in the near future.
There was more ice than recent years, but no bumper crop.
Was much below the long term averages.
But the maximum arrived quite early, around March 5th by my eye.
Could be a record early date, however memory is imperfect.
We shall await the official verdict.
 

Attachments

  • N_iqr_timeseries.jpg
    N_iqr_timeseries.jpg
    50.2 KB · Views: 33
  • N_daily_extent_hires.jpg
    N_daily_extent_hires.jpg
    104.3 KB · Views: 35

Yamaha FG-840

Active member
Explain to every ignorant illiterate hick you meet that thought the ''Thim cold Nitchurgin baths is heedurs now cawse yaw used yaw sum fiar and made'jaw sum FIAR SIN'' story is thermodynamics, that no,

NO cold light blocking Nitrogen bath is EVER a heater.

Explain to them there's an entire chart of ''Stefan-Boltzmann Temperatures of Planets'' and that not ONE of them is the correct official temperature of a planet/atmosphere.

There's a whole separate chart of ''temperatures of planets.''
NOT ONE of THOSE TEMPERATURES is the STEFAN-BOLTZMANN temperature for a planet/atmosphere.

Explain to the heathen who doesn't know cold Nitrogen baths can't EVER be heaters, that the reason their church didn't teach them the real temperature of the planet and how to calculate it, is because their ridiculous claims don't stand up if a person even knows the name of the LAW used to
ACTUALLY calculate the
ACTUAL temperature
of this or any other planet.

Tell them there's also a reason their handlers don't tell them the NAME of the ACTUAL OFFICIAL GLOBAL STANDARD
for global CLIMATE PARAMETERS: because the REAL global OFFICIAL TEMPERATURE has a REAL official LAW and METHOD for CALCULATING IT

and their FAKE -18C doesn't appear A.N.Y.W.H.E.R.E. in the string of derivations leading to the REAL OFFICIAL actual TEMPERATURE of this planet.

Explain to the ignorant clown that there's a REASON there are GAS laws and the REASONS they EXIST are the REASONS you can't use Stefan Boltzmann to calculate the temperature of the planet/atmosphere.

Explain to them that ''Evur time thim green and housie wuns, done made less energy two have go'd intwo the Eurth, thay dun made MOAR come OUT causa HOW thay done made LESS two have WiN'T iNNiT!''

isn't real thermodynamics.

And that their KOOK method of calculating the WRONG temperature, doesn't mean, that magic is making more energy come out of Earth every time Green House Gases make less go in,

it just means they're so stupid they didn't know there have to be GAS LAWS to actually calculate GAS TEMPERATURES or you

WILL ALWAYS COME UP that SAME 33 DEGREES SHORT that's on EVERY single

''Stefan-Boltzmann Temperatures of Planets'' chart on the planet.

Because STEFAN BOLTZMANN can't CALCULATE temperatures of gases. IT doesn't HAVE the PROCESSES to DEAL with what's called ''Hydrostatics.'' There's no HYDROSTATIC EQUATION in Stefan-Boltzmann process

HENCE COMING UP 33 DEGREES SHORT in their FAKE claims of ''calculating'' planet temperature.

NO, they're NOT calculating temperature they're calculating the STEFAN-BOLTZMANN ERROR of 33 degrees SHORT.

-18C or 255 Kelvin NOWHERE APPEARS in REAL CALCULATION of the TEMPERATURE of the PLANET SURFACE.

END of STORY.

It's WHY Magic Gassers' HANDLERS don't even teach them there have to be GAS LAWS USED to CALCULATE GAS mass-energy relationships.

NOT EVEN KNOWING A LAW HAS TO EXIST and that one's HANDLERS used the WRONG ONE to calculate a FAKE temperature is the MARK of the ''Cold Nitchurgin baths is heedurs now cawse yaw used yaw sum fiar and madejaw sum fiar sin'' clowns.

Explain to them that their OWN HANDLERS STORY shows them, the believers that cold Nitrogen baths are heaters now because of using fire creating ''fire sin''

the trail of acts whereby their handlers
USING the WRONG LAW

to calculate the WRONG TEMPERATURE

Tell them OUTRIGHT: ''We are going to COOL our final temperature 23% due to Green House Gases not letting that energy ever reach and warm Earth''

and that when they wind up 33 degrees short they turn around and say ''THE PERCENTAGE WE HAVE COME UP SHORT is because GREEN HOUSE GASES are MAKING MORE ENERGY COME OUT of the PLANET, by MAKING LESS GO IN.''

YES they DO.

Tell the magic gas believing clown that he just needs to go check his church's web sites,

where they SHOW them remove 29% TOTAL
from their OWN FINAL CALCULATIONS - using STEFAN BOLTZMANN -
and that 29% FINAL COOLING of their OWN calculated temperature,
consists of

6% COOLING of their final calculated temperature due to Ozone/Oxygen losses (Rayleigh losses creating our Oxygen-blue daylight sky conditions plus the losses from Ozone itself)

and

23% of their COOLING of their OWN erroneous FINAL TEMPERATURE is created by THEIR SUBTRACTING 23% from TOTAL SUNLIGHT WARMING EARTH
due to GREEN HOUSE GASES not LETTING that ENERGY ever join Earth's energy budget.

''Snow, Ice, reflections from clouds and water'' are what they talk about removing this energy BECAUSE of - all of these are the MAIN GREEN HOUSE GAS WATER and also Carbon Dioxide creates a small part of that 23% COOLING of THE MAGIC GAS CHURCH'S WRONG
TEMPERATURE
CALCULATION.

IN REAL gas calculations THESE ENERGIES are NOT SUBTRACTED
as they are in the ERROR DELIVERING STEFAN-BOLTZMANN process.

Hence REAL gas law delivering the REAL temperature of the PLANET,

and STEFAN-BOLTZMANN delivering that MANDATORY 33 degree SHORTFALL.

No negotiations, the CHURCHA the MAGICAL GAiSSiNESS, what done ''Made thim cold Nitchurgin baths to have ''come a Heedur"

shows the loons who can't count, THEMSELVES COOLING THE FINAL ERRONEOUS TEMPERATURE they GENERATE using SUBTRACTIONS created by the GREEN HOUSE GASES.

Then when their temperature comes up SHORT they turn around and claim that ''THIM GREEN AND HOUSIE WUNS, is MAKING MORE COME OUT, EVUR TIME THAY MAKE LESS GO IN, which is WHY our
CALCULATED TEMPERATURE is 33 DEGREES W.R.O.N.G. - SHORT.

NO, the REASON their TEMPERATURE is WRONG is because STEFAN BOLTZMANN can't DERIVE actual GAS TEMPERATURES of ATMOSPHERES and PLANETS because it can't account for parts of

COMPRESSIBLE PHASE MATTER CALCULATIONS
that make GAS LAWS NECESSARY.
=====================

All these glaring errors are why NO magic gasser can tell you ANYTHING realistic about the calculating of the temperature of the Atmosphere.

They don't KNOW the name even of the LAW they're squirting spam onto the internet about.

The vast, VAST majority of them don't even know why gas law would be NEEDED to calculate gas temperatures.

They also can't tell you where to find, or show you ANY chart declaring the enrichment of Air with CO2 will raise it's temperature.

That's because addition of CO2 to Air, REDUCES retained energy.

And if they knew the LAW to CALCULATE a GAS TEMPERATURE
they'd have to know where the CHART is assigning AIR and CO2 their ENERGY constants.

The NAME of the CHART is the SOLE ONE in ALL THERMODYNAMICS for this cause and it's named the CHART of SPECIFIC HEATS of GASES,
and it's PART II of the GAS LAW USED to properly CALCULATE Atmospheric and other gas temperatures.

The SPECIFIC HEATS of GASES is THE OFFICIAL CHART
of THE OFFICIAL LAW
to calculate
THE OFFICIAL TEMPERATURE of everything from our Atmosphere to the Atmosphere of Venus and Mars and even inside ovens. This chart is used in CALIBRATION and LEGAL WARRANTYING of TEMPERATURE/PRESSURE etc related MANUFACTURED GOODS globally including AERONAUTICAL and AEROSPACE engines, control surfaces - even SCUBA DIVERS must use this SAME CHART
which is a sub section of the SAME LAW

used in arriving at correct temperatures in all those sciences.

The SUB-CHART which is DIRECTLY DERIVED from the Chart of Specific Heats of Gases

is called the ''CHART of GAS (energy) CONSTANTS''

and on LINE 3 of the CHART is AIR.
And on LINE 15 of the CHART is CO2.

And CO2 has the LOWER ENERGY RETENTION PER MOLE AVERAGE, in ALL MIXTURES.

If you have a volume of AIR it can RETAIN a certain amount of energy
If you have a volume of CO2 it can retain from 15 to 30% LESS energy -

NEVER EQUAL
NEVER MORE.

This is WHY ALL MAGIC GASSERS show UP and try to talk with you and declare - THEY NEVER HURDA NUNNA THIM GAIS LAWS and THANGS, what ain't about thim
AT MUS FEARS

and it's why they are SHOCKED the CHART EXISTS: their handlers LIED to them and told them ENRICHING AIR witH CO2 makes the RESULTANT MIX RETAIN MORE ENERGY.

It's OUTRIGHT DEFIANCE of THE GAS LAW SPECIFICALLY WRITTEN,
NAMING AIR,

NAMING CO2

for the express PURPOSE of being able to tell the TEMPERATURES of RESULTANT MIXES when they put together.

That CHART is HERE: AND ALL SCIENCES involved with gas mass-energy USE it.

NO CHART EXISTS in the STEFAN-BOLTZMANN PROCESS for DETERMINING this relationship between gases.

https://www.engineeringtoolbox.com/specific-heat-capacity-gases-d_159.html

Every last illiterate moron who believes ''Thim cold Nitchurgin baths is HeeDuRs NOW cawse YAW done USED YAW sum FIAR and MADE'JAW sum FIAR SIN''

will tell you the same thing: they have NEVER HEARD there is an actual GLOBALLY ADOPTED BASE CLIMATE PARAMETERS SET in INTERNATIONAL STANDARDS.

That Base Climate Parameters set is named the INTERNATIONAL STANDARD ATMOSPHERE

and it's values were first calculated and published by the French in 1864.

In 1950 the entire PLANET adopted the International Standard Atmosphere just as calculated by the French: unchanged in the 90 years since first calculated, measured and distributed to the world.

This SAME standards SET is the one used TODAY

and is the same one UPDATED by the AMERICANS in 1976 WHEN THEY PUBLISHED the

AMERICAN STANDARD ATMOSPHERE
which is a RE PUBLISHING of the 1950s (hence 1864) values for TEMPERATURE, PRESSURE, HUMIDITY, ETC

with THE RESULTS COMPUTER AGGREGATED from MILLIONS of FLIGHTS between 1950 and 1976 including ORBITAL flights: and the US STANDARD ATMOSPHERE

includes UPDATED INFO going up another 200,000 feet to help the WORLD enter the COMPUTER INSTRUMENTS GUIDED ORBITAL/RE-ENTRY age.

The temperature of the planet has not changed ONE WHIT
or the CALIBRATION of INSTRUMENTS
and the FLYING and LANDING of CRAFT on THIS PLANET and all the OTHERS we use the SAME LAW to LAND CRAFT ON - would have to change, too or TAKE-OFF/LANDING, instrument-calibration and thermostat WARRANTY REGULATIONS would HAVE to CHANGE AS WELL.

NO NEGOTIATIONS.

Which is why EVERYONE who tells you they thought that sh* is real and that ''COLD NITROGEN BATHS are HEATERS NOW because WE USED FIRE and made FIRE SIN''

are as UTTERLY illiterate as you can imagine someone having to be, to have people CALCULATE the TEMPERATURE WRONG - SHOWING THEM, they're DOING it - and for them to say ''I see NOTHING WRONG with REDUCING the TEMPERATURE 23% due to GREEN HOUSE GASES, then claiming GREEN HOUSE GASES are MAKING your TEMP CALCULATIONS WRONG.

That's how stupid the believers in this ARE. Their handlers SHOW them using the WRONG LAW

shorting their OWN calculated tempeature 33 degrees,

showing them REDUCING their OWN FINAL CALCULATED TEMPERATURE DUE to this COOLING they CLAIM the GREEN HOUSE GASES are DOING -

then turning to them and telling them ''IT's thim GREEN and HOUSIE WUNS thay dun made TEMPURCHURES WARMER THAN SIGNTIST CALCULATED!''

Well that's what happens when you SHORT the TEMPERATURE by ENERGY LEVELS you CLAIM are REDUCED by GREEN HOUSE GASES
and
BLAME GREEN HOUSE GASES for YOUR TEMPERATURE CALC BEING SHORT.

And that IS what they do, ANYONE can go to ANY of their sites where they tell about their FRAUD and SEE them DO it.
 

Yamaha FG-840

Active member
Questions to ask Magic-Gas-Billies:

have them tell you the name of the law used to officially calculate the temperature of the planet.

They won't know.

Have them tell you why there have to BE gas laws and why the GAS related industries like thermo-sensing and ovens and aircraft and spacecraft parts and the welding business and the scuba business, the furnaces and A/C businesses DON'T USE STEFAN BOLTZMANN to CALCULATE any GAS TEMPERATURES.

NOT ONE of them DO and the FLIGHT business is PARTICULARLY dependent on knowing the right temperature of an air volume or their craft might not take off in the right distances, might not land in the right distances, might encounter icing.

IT's the SAME THING for OVENS and A/Cs and for even WELDING and COMBUSTION ENGINE DESIGN:

NO GAS INDUSTRY USES FAKE STEFAN BOLTZMANN DERIVATIVES for GAS RELATED TEMPERATURE CALCULATION.

NONE.

Because STEFAN BOLTZMANN is A.L.W.A.Y.S. WRONG, when CALCULATING a GAS temperature.

Ask the Magic Gas Billy to tell you the name of the chart their handlers use to calculate the temperatures of gases.

https://www.engineeringtoolbox.com/specific-heat-capacity-gases-d_159.html

When they don't show you that chart you call them a fraud barking fake THAT instant.

There's only ONE in ALLLLLLLLLLLLLLLL THERMODYNAMICS to FIND OUT if ENRICHMENT with CO2

makes an air volume hold less or more energy.

THE LAW STATES CLEARLY, NAMING EACH: that ADDITION of CO2 to AIR makes it hold LESS ENERGY.
NOT MORE.

NO NEGOTIATIONS.

Do not BUDGE from this EVER. This is THE LAW USED to FORMALLY CALCULATE the REAL TEMPERATURE of the PLANET.

ASK the MAGIC GAS BILLY to tell you the NAME of the GLOBAL BASE CLIMATE PARAMETERS STANDARD: the name of it is the International Standard Atmosphere,

THEY WON'T KNOW,
because CALCULATION of the REAL TEMPERATURE

NEVER
EVER
DELIVERS
a DERIVATION of -18C or 255 Kelvin.

NOT EVER.

Ask the MAGIC GAS BILLY to show you ANOTHER cold light blocking, Oxygen-enriched NITROGEN BATH that is a HEATER because ''some people made some fire sin'' by ''using devil fire.''

Ask the Magic Gas Billy to explain to you how the class gases causing their handlers to LOWER their OWN FINAL CALCULATED TEMPERATURE 23% - this is part and parcel of classic STEFAN BOLTZMANN - it's HOW it's done TO arrive AT THOSE WRONG TEMPS for GASES -

tell the Magic Gas Billy to explain to you how ''Every time thim green and housie wuns make less energy reach and go into Earth,

this makes instruments detect and depict MORE energy reaching going into and coming out of Earth,

every time they make LESS reach it and go INTO IT

because of ''what done to have made less to have wint innit.''

Tell the magic gas barking illiterbilly to explain to you how that works in detail.

Tell them it's RIGHT their own their CHURCH WEBSITES that EVERY TIME those GREEN HOUSE GASES make LESS ENERGY REACH and WARM EARTH
this makes instruments detect MORE ENERGY reaching and warming EARTH,
because of how
what MAKES less energy never reach and warm Earth,
never reach and warm Earth.

Have the illiterbilly explain that to you. Take him over to his Church website and show him STEP by STEP how their handlers are

CALCULATING the TEMPERATURE SHORT 33 DEGREESS
REDUCING FINAL TEMPERATURE due to COOLING they claim happening
DUE TO
GREEN HOUSE GASES
BY 23%

THEN SHOW them that their handlers are telling them they REDUCED TEMPERATURE 23% due to GREEN HOUSE GASES - then they are told that these
SAME GREEN HOUSE GASES
they
JUST REDUCED their OWN FINAL CALCULATED TEMPERATURE by 23% because of,
are ''Making moar and moar come out, evur time less done to have WINT INNIT!''

Have them explain to you how that's possible that EVUR TIME LESS DONE TO HAVE WINT INNIT,

it ''done made moar two have COME OUT''

because of ''what done to have made less to have wint innit.''


Tell the Magic Gas billy to show you a chart of ''Stefan Boltzmann temperatures of planets''

that MATCHES the REAL TEMPERATURES of PLANETS chart.

When it DOESN'T

ask them ''Why is Stefan-Boltzmann always WRONG? wHAT is STEFAN BOLTZMANN not COUNTING that REAL gas law,
that derives REAL temperatures,
actually COUNTS, to deliver REAL TEMPERATURES?''

The magic gas billy will be floored that such a question can even exist since he's so stupid he didn't know you have to USE gas law to DERIVE correct gas temps.

The correct answer is that Stefan-Boltzmann has no process for calculation of Hydrostatic Condition.

Using the Hydrostatic Equation. < - - - that's the textbook correct answer. Stefan-Boltzmann has no Hydrostatic Equation to manage the Hydrostatic Condition.

They won't know the FIRST THING about even HOW or WHERE to find out HOW to CALCULATE the

REAL TEMPERATURE of the PLANET.

The OFFICIAL TEMPERATURE of the PLANET.

Remind the Magic Gasser that we KNOW the REAL GAS LAW WORKS because we USE IT TO LAND CRAFT on VENUS and MARS and EARTH,

and on Earth, it's ALL DAY EVERY DAY.

No Magic Gas Billy will be able to discuss ANYTHING about properly calculating a gas temperature and will act STUNNED gas laws actually have to be USED.

They're ALL utter illiterates about even BASICS in gas mass-energy relationships.

NONE of them even KNOW there's a CHART that was WRITTEN: NAMING AIR... NAMING CO2 - that

MANDATES enrichment of AIR, WITH CO2, cause it to retain LESS energy.

They'll hate your guts for KNOWING about gases, why the laws for them have to exist, and that their HILLBILLY CHURCH has BEFUDDLED them into believing

COLD
light blocking
Oxygen-enriched
NITROGEN BATHS
are HEATERS NOW
because of ''USING FIRE''

making ''the sky hot.''

Every last ONE who'll even say they think it MIGHT be possible - will be INSTANTLY revealed to be UTTERLY illiterate about what a COLD NITROGEN BATH

is

and

DOES.
 

Phaeton

Speed of Dark
Veteran
Whew, the preceding is some dense dialect.
I still am not sure what the gist of the two posts were, other than some problem with a guy named Stephan. Unsure whether I am supposed to be for or against Stephan or if he is just some passerby taking a hit as a bad example.

It snowed a lot in my area, shovel the roof warnings were given. Three hundred miles north they wish it would snow. If we only take our own backyards into account it would seem the world is going two directions at the same time.
More white folk in my area, eat duck soup brown people, your weather loses.
 

trichrider

Kiss My Ring
Veteran
  • picture.php

  • This visualization shows the Gulf Stream's sea surface currents and and temperatures.
    Image: MIT/JPL project entitled Estimating the Circulation and Climate of the Ocean, Phase II (ECCO2)
Staring into the vortex

MIT researchers describe factors governing how oceans and atmospheres move heat around on Earth and other planetary bodies.

EAPS
March 19, 2020

Imagine a massive mug of cold, dense cream with hot coffee poured on top. Now place it on a rotating table. Over time, the fluids will slowly mix into each other, and heat from the coffee will eventually reach the bottom of the mug. But as most of us impatient coffee drinkers know, stirring the layers together is a more efficient way to distribute the heat and enjoy a beverage that’s not scalding hot or ice cold. The key is the swirls, or vortices, that formed in the turbulent liquid.


“If you just waited to see whether molecular diffusion did it, it would take forever and you'll never get your coffee and milk together,” says Raffaele Ferrari, Cecil and Ida Green Professor of Oceanography in MIT’s Department of Earth, Atmospheric and Planetary Sciences (EAPS).


This analogy helps explain a new theory on the intricacies the climate system on Earth — and other rotating planets with atmospheres and/or oceans — outlined in a recent PNAS paper by Ferrari and Basile Gallet, an EAPS visiting researcher from Service de Physique de l'Etat Condensé, CEA Saclay, France.


It may seem intuitive that Earth’s sun-baked equator is hot while the relatively sun-deprived poles are cold, with a gradient of temperatures in between. However, the actual span of that temperature gradient is relatively small compared to what it might otherwise be because of the way the Earth system physically transports heat around the globe to cooler regions, moderating the extremes.


Otherwise, “you would have unbearably hot temperatures at the equator and [the temperate latitudes] would be frozen,” says Ferrari. “So, the fact that the planet is habitable, as we know it, has to do with heat transport from the equator to the poles.”
Yet, despite the importance of global heat flux for maintaining the contemporary climate of Earth, the mechanisms that drive the process are not completely understood. That’s where Ferrari and Gallet’s recent work comes in: their research lays out a mathematical description of the physics underpinning the role that marine and atmospheric vortices play in redistributing that heat in the global system.


Ferrari and Gallet’s work builds on that of another MIT professor, the late meteorologist Norman Phillips, who, in 1956, proposed a set of equations, the “Phillips model,” to describe global heat transport. Phillips’ model represents the atmopshere and ocean as two layers of different density on top of each other. While these equations capture the development of turbulence and predict the distribution of temperature on Earth with relative accuracy, they are still very complex and need to be solved with computers. The new theory from Ferrari and Gallet provides analytical solutions to the equations and quantitatively predicts local heat flux, energy powering the eddies, and large-scale flow characteristics. And their theoretical framework is scalable, meaning it works for eddies, which are smaller and denser in the ocean, as well as cyclones in the atmosphere that are larger.


Setting the process in motion
The physics behind vortices in your coffee cup differ from those in nature. Fluid media like the atmosphere and ocean are characterized by variations in temperature and density. On a rotating planet, these variations accelerate strong currents, while friction — on the bottom of the ocean and atmosphere — slows them down. This tug of war results in instabilities of the flow of large-scale currents and produces irregular turbulent flows that we experience as ever-changing weather in the atmosphere.
Vortices — closed circular flows of air or water — are born of this instability. In the atmosphere, they’re called cyclones and anticyclones (the weather patterns); in the ocean they’re called eddies. In both cases, they are transient, ordered formations, emerging somewhat erratically and dissipating over time. As they spin out of the underlying turbulence, they, too, are hindered by friction, causing their eventual dissipation, which completes the transfer of heat from the equator (the top of the hot coffee) to the poles (the bottom of the cream).


Zooming out to the bigger picture
While the Earth system is much more complex than two layers, analyzing heat transport in Phillips’ simplified model helps scientists resolve the fundamental physics at play. Ferrari and Gallet found that the heat transport due to vortices, though directionally chaotic, ends up moving heat to the poles faster than a more smooth-flowing system would. According to Ferrari, “vortices do the dog work of moving heat, not disorganized motion (turbulence).”


It would be impossible to mathematically account for every single eddy feature that forms and disappears, so the researchers developed simplified calculations to determine the overall effects of vortex behavior, based on latitude (temperature gradient) and friction parameters. Additionally, they considered each vortex as a single particle in a gas fluid. When they incorporated their calculations into the existing models, the resulting simulations predicted Earth’s actual temperature regimes fairly accurately, and revealed that both the formation and function of vortices in the climate system are much more sensitive to frictional drag than anticipated.


Ferrari emphasizes that all modeling endeavors require simplifications and aren’t perfect representations of natural systems — as in this instance, with the atmosphere and oceans represented as simple two-layer systems, and the sphericity of the Earth is not accounted for. Even with these drawbacks, Gallet and Ferrari’s theory has gotten the attention of other oceanographers.
“Since 1956, meteorologists and oceanographers have tried, and failed, to understand this Phillips model,” says Bill Young, professor of physical oceanography at Scripps Institution of Oceanography, “The paper by Gallet and Ferrari is the first successful deductive prediction of how the heat flux in the Phillips model varies with temperature gradient.”


Ferrari says that answering fundamental questions of how heat transport functions will allow scientists to more generally understand the Earth’s climate system. For instance, in Earth’s deep past, there were times when our planet was much warmer, when crocodiles swam in the arctic and palm trees stretched up into Canada, and also times when it was much colder and the mid-latitudes were covered in ice. “Clearly heat transfer can change across different climates, so you'd like to be able to predict it,” he says. “It's been a theoretical question on the minds of people for a long time.”


As the average global temperature has increased more than 1 degree Celsius in the past 100 years, and is on pace to far exceed that in the next century, the need to understand — and predict — Earth’s climate system has become crucial as communities, governments, and industry adapt to the current changing environment.


“I find it extremely rewarding to apply the fundamentals of turbulent flows to such a timely issue,” says Gallet, “In the long run, this physics-based approach will be key to reducing the uncertainty in climate modelling.”


Following in the footsteps of meteorology giants like Norman Phillips, Jule Charney, and Peter Stone, who developed seminal climate theories at MIT, this work too adheres to an admonition from Albert Einstein: "Out of clutter, find simplicity."


https://news.mit.edu/2020/staring-into-ocean-atmospheric-vortex-0319
 

trichrider

Kiss My Ring
Veteran
The Polar Wind Modulated by the Spatial Inhomogeneity of the Strength of the Earth's Magnetic Field

Kun Li
Matthias Förster
Zhaojin Rong
Stein Haaland
Elena Kronberg
Jun Cui
Lihui Chai
Yong Wei


First published: 25 March 2020
https://doi.org/10.1029/2020JA027802

This article has been accepted for publication and undergone full peer review but has not been through the copyediting, typesetting, pagination and proofreading process, which may lead to differences between this version and the Version of Record. Please cite this article as doi: 10.1029/2020JA027802


PDF
Tools
Share


Abstract

When the geomagnetic field is weak, the small mirror force allows precipitating charged particles to deposit energy in the ionosphere. This leads to an increase in ionospheric outflow from the Earth's polar cap region, but such an effect has not been previously observed because the energies of the ions of the polar ionospheric outflow are too low, making it difficult to detect the low‐energy ions with a positively charged spacecraft. In this study, we found an anti‐correlation between ionospheric outflow and the strength of the Earth's magnetic field. Our results suggest that the electron precipitation through the polar rain can be a main energy source of the polar wind during periods of high levels of solar activity. The decreased magnetic field due to spatial inhomogeneity of the Earth's magnetic field and its effect on outflow can be used to study the outflow in history when the magnetic field was at similar levels.

Plain Language Summary

Earth, Venus, and Mars have very different atmospheres although they are thought to possess similar atmospheres about 4.5 billion years ago. One of the main reasons considered for the losses of H2O and O2 is dramatic decreases in the dipole magnetic field on Venus and Mars. Although the Earth has kept its intrinsic magnetic field, there are variations in both orientation and strength. Previous observations have confirmed that atmospheric loss is controlled by the orientation of the geomagnetic dipole tilt angle. However, the effect of variations in the strength of the Earth's magnetic field on atmospheric outflow has not been addressed. In this study, we have focused on the polar wind, the dominant ionospheric outflow from the polar regions. Our results reveal an anti‐correlation between the outflow and the strength of the Earth's magnetic field, offering us a clue on the ionospheric and atmospheric evolution with a changing magnetic field.
 

trichrider

Kiss My Ring
Veteran
https://par.nsf.gov/servlets/purl/10068247

Reviews of Geophysics


Current Systems in the Earth’s Magnetosphere


N. Yu. Ganushkina1,2, M. W. Liemohn1, and S. Dubyagin21

Department of Climate and Space Sciences and Engineering, University of Michigan, Ann Arbor, MI, USA,2

Space and EarthObservation Centre, Space Research and Observation Technologies, Finnish Meteorological Institute, Helsinki, Finland
Abstract
The basic structure and dynamics of the primary electric current systems in the Earth’s magnetosphere are presented and discussed. In geophysics, the word current is used to describe the flow of mass from one location to another, and its analog of electric current is a flow of charge from one place to another. An electric current is associated with a magnetic field, and they combine with the Earth’s internally generated dipolar magnetic field to form the topology of the magnetosphere. The concept of an electric current is reviewed and compared with other approaches to investigate the physics of the magnetosphere. The implications of understanding magnetospheric current systems are discussed,including paths forward for new investigations with the robust set of observations being produced by the numerous scientific and commercial satellites orbiting Earth.


i'll use this as place-holder till i finish reading the paper. pretty sure that MIT article is a useful correlation to this paper or visa versa.
 

trichrider

Kiss My Ring
Veteran
The Saturation of the Infrared Absorption by Carbon Dioxide in the Atmosphere


Dieter SchildknechtFakult ̈at f ̈ur Physik, Universit ̈at BielefeldD-33501 Bielefeld, Germany
Abstract

Based on new radiative-transfer numerical evaluations, we reconsider an argument presented by Schack in 1972 that says that saturation of the absorption of infrared radiation by carbon dioxide in the atmosphere sets in as soon as the relative concentration of carbon dioxide exceeds a lower limit of approximately 300ppm. We provide a concise brief and explicit representation of the greenhouse effect of the earth’s atmosphere. We find an equilibrium climate sensitivity (temperature increase ∆T due to doubling of atmospheric CO2 concentration) of ∆T0.50C.

Conclusions

It has been the aim of this paper to estimate the increase in temperature ∆T(“climate sensitivity”) of the surface of the earth due to a doubling of the CO2 concentration in the atmosphere. The estimate is obtained in a concise and transparent manner without oversimplification. All necessary steps are explicitly elaborated upon.The basic assumption of associating a uniform constant temperature T with the surface of the earth, and a black-body long-wave infrared radiation S(T), is by no means trivial, implicitly or explicitly, however, common to main-stream investigations on this matter. Our results are based on a new radiative-transfer evaluation, the details being presented in Appendix A.

The absorption of the atmosphere in the CO2 spectral range can be, and is reliably determined, and leads to an approximately constant value beyond an altitude of about 5 km, or a length of the horizontal CO2-air pipe of about 3 km at surface temperature and pressure. Assuming restoration of equilibrium upon doubling of theCO2 concentration by an associated increase of the temperature then implies a definite estimate of the increase of the surface temperature ∆T, given by ∆T=0.50C that confirms, or is being confirmed by, more detailed investigations in the literature.The quantitative result of ∆T0.5 to 0.60 C valid for the drastic increase of doubling of the CO2 content in air from 380 ppm to 760 ppm to be related to one century, confirms that the effect of an anthropogenic CO2 increase on the climate on earth is fairly negligible. This conclusion is in strong contrast to the values of ∆T1.54.50 C quoted in the 2013 IPCC report [11]. The published results on ∆T fill an even larger interval between T0.40 C to ∆T80 C. There is a systematic tendency of the results on ∆T published between the years 2000 to 2018 to decrease [12] with increasing publication date, the results coming closer to our result of ∆T0.50 C. In this connection, compare also ref.[13] on “No Experimental Evidence for the Significant Anthropogenic Climate Change”. We found a concise and brief derivation of the earth’s greenhouse effect (compare Appendix B, in particular figure B1). The greenhouse effect is explicitly derived. It is understood as a shift of the radiative equilibrium from the earth’s surface to an atmospheric level above approximately five kilometers.


https://arxiv.org/pdf/2004.00708.pdf
 

trichrider

Kiss My Ring
Veteran
Traces of ancient rainforest in Antarctica point to a warmer prehistoric world
by Hayley Dunning 01 April 2020

newseventsimage_1585326367406_mainnews2012_x1.jpg


Illustration of the Antarctic rainforest. Credit:
Alfred-Wegener-Institut/James McKay

Researchers have found evidence of rainforests near the South Pole 90 million years ago, suggesting the climate was exceptionally warm at the time.
A team from the UK and Germany discovered forest soil from the Cretaceous period within 900 km of the South Pole. Their analysis of the preserved roots, pollen and spores shows that the world at that time was a lot warmer than previously thought.
The preservation of this 90-million-year-old forest is exceptional, but even more surprising is the world it reveals. Professor Tina van de Flierdt​
The discovery and analysis were carried out by an international team of researchers led by geoscientists from the Alfred Wegener Institute Helmholtz Centre for Polar and Marine Research in Germany and including Imperial College London researchers. Their findings are published today in Nature.

Co-author Professor Tina van de Flierdt, from the Department of Earth Science & Engineering at Imperial, said: “The preservation of this 90-million-year-old forest is exceptional, but even more surprising is the world it reveals. Even during months of darkness, swampy temperate rainforests were able to grow close to the South Pole, revealing an even warmer climate than we expected.”

Warmest period in the past 140 million years

The work also suggests that the carbon dioxide (CO2) levels in the atmosphere were higher than expected during the mid-Cretaceous period, 115-80 million years ago, challenging climate models of the period.

The mid-Cretaceous was the heyday of the dinosaurs but was also the warmest period in the past 140 million years, with temperatures in the tropics as high as 35 degrees Celsius and sea level 170 metres higher than today.

However, little was known about the environment south of the Antarctic Circle at this time. Now, researchers have discovered evidence of a temperate rainforest in the region, such as would be found in New Zealand today. This was despite a four-month polar night, meaning for a third of every year there was no life-giving sunlight at all.

The presence of the forest suggests average temperatures were around 12 degrees Celsius and that there was unlikely to be an ice cap at the South Pole at the time.

Reconstructing the climate

The evidence for the Antarctic forest comes from a core of sediment drilled into the seabed near the Pine Island and Thwaites glaciers in West Antarctica. One section of the core, that would have originally been deposited on land, caught the researchers’ attention with its strange colour.

The team CT-scanned the section of the core and discovered a dense network of fossil roots, which was so well preserved that they could make out individual cell structures. The sample also contained countless traces of pollen and spores from plants, including the first remnants of flowering plants ever found at these high Antarctic latitudes.

To reconstruct the environment of this preserved forest, the team assessed the climatic conditions under which the plants’ modern descendants live, as well as analysing temperature and precipitation indicators within the sample.

Covered in dense vegetation

They found that the annual mean air temperature was around 12 degrees Celsius; roughly two degrees warmer than the mean temperature in Germany today. Average summer temperatures were around 19 degrees Celsius; water temperatures in the rivers and swamps reached up to 20 degrees; and the amount and intensity of rainfall in West Antarctica were similar to those in today’s Wales.

To get these conditions, the researchers conclude that 90 million years ago the Antarctic continent was covered with dense vegetation, there were no land-ice masses on the scale of an ice sheet in the South Pole region, and the CO2 concentration in the atmosphere was far higher than previously assumed for the Cretaceous.

https://www.imperial.ac.uk/news/196516/traces-ancient-rainforest-antarctica-point-warmer/
 

igrowone

Well-known member
Veteran
time again for a peek at the thermometer that's up mother earth's rectum
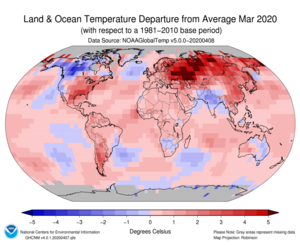
March 2020 was warm, shocking i know
2nd warmest in the record, here's the details

Monthly Temperature: March 2020

March 2020 was characterized by warmer-than-average conditions across much of the globe. The most notable warm March temperatures were present across much of Asia, the eastern half of the contiguous U.S., and southern South America where temperatures were 2.0°C (3.6°F) above average or higher. Some ocean areas were notable as well, including parts of the tropical Atlantic Ocean, central Indian Ocean, and parts of the northern and southwestern Pacific Ocean, where temperatures were 1.5°C (2.7°F) above average or higher. The most notable cool temperatures departures were present across Canada, Alaska, northern India, parts of the North Atlantic Ocean, and the Antarctic.

March 2020 Blended Land and Sea Surface
Temperature Anomalies in degrees Celsius


March 2020 Blended Land and Sea Surface
Temperature Percentiles

Record-warm March surface temperatures were present across parts of the Atlantic, Indian, and western Pacific oceans, as well as parts of southern North America, South America, Asia, and Africa. Overall, March 2020 had 8.17% of the world's land and ocean surfaces having a record high March temperature, considering a 1951 start date, when global coverage grew. This was the second highest percentage of record-warm March temperatures of that era. Only March 2016 had a higher percentage with 15.47%. One small area across the North Atlantic, representing 0.06% of the globe, had a record-cold March temperature.
Averaged as a whole, the global land and ocean surface temperature for March 2020 was 1.16°C (2.09°F) above the 20th century average of 12.7°C (54.9°F) and the second highest in the 141-year record. Only March 2016 was warmer at 1.31°C (2.36°F). The 10 warmest Marches have all occurred since 1990, with Marches of 2016, 2017, 2019, and 2020 having a global land and ocean surface temperature departure from average above 1.0°C (1.8°F). The March 2020 global land and ocean surface temperature departure tied with February 2020 and December 2015 as the third highest monthly temperature departure from average in the 1,683-month record. Only February and March 2016, when a strong El Niño was present in the tropical Pacific Ocean, had higher temperature departures.
 

St. Phatty

Active member
It snowed a lot in my area, shovel the roof warnings were given. Three hundred miles north they wish it would snow. If we only take our own backyards into account it would seem the world is going two directions at the same time.

Summer is here in Southern Oregon.

Got about 5 clone re-gens that are transitioning to Veg awfully slowly, so I might plant some seeds.

Fire season will be starting unwelcome soon.
 
M

moose eater

time again for a peek at the thermometer that's up mother earth's rectum
March 2020 was warm, shocking i know
2nd warmest in the record, here's the details

Monthly Temperature: March 2020

March 2020 was characterized by warmer-than-average conditions across much of the globe. The most notable warm March temperatures were present across much of Asia, the eastern half of the contiguous U.S., and southern South America where temperatures were 2.0°C (3.6°F) above average or higher. Some ocean areas were notable as well, including parts of the tropical Atlantic Ocean, central Indian Ocean, and parts of the northern and southwestern Pacific Ocean, where temperatures were 1.5°C (2.7°F) above average or higher. The most notable cool temperatures departures were present across Canada, Alaska, northern India, parts of the North Atlantic Ocean, and the Antarctic.
[URL=https://www.ncdc.noaa.gov/sotc/service/global/map-blended-mntp/202003-t.png]View Image
March 2020 Blended Land and Sea Surface
Temperature Anomalies in degrees Celsius[/URL]
[URL=https://www.ncdc.noaa.gov/sotc/service/global/map-percentile-mntp/202003-t.png]View Image
March 2020 Blended Land and Sea Surface
Temperature Percentiles[/URL]
Record-warm March surface temperatures were present across parts of the Atlantic, Indian, and western Pacific oceans, as well as parts of southern North America, South America, Asia, and Africa. Overall, March 2020 had 8.17% of the world's land and ocean surfaces having a record high March temperature, considering a 1951 start date, when global coverage grew. This was the second highest percentage of record-warm March temperatures of that era. Only March 2016 had a higher percentage with 15.47%. One small area across the North Atlantic, representing 0.06% of the globe, had a record-cold March temperature.
Averaged as a whole, the global land and ocean surface temperature for March 2020 was 1.16°C (2.09°F) above the 20th century average of 12.7°C (54.9°F) and the second highest in the 141-year record. Only March 2016 was warmer at 1.31°C (2.36°F). The 10 warmest Marches have all occurred since 1990, with Marches of 2016, 2017, 2019, and 2020 having a global land and ocean surface temperature departure from average above 1.0°C (1.8°F). The March 2020 global land and ocean surface temperature departure tied with February 2020 and December 2015 as the third highest monthly temperature departure from average in the 1,683-month record. Only February and March 2016, when a strong El Niño was present in the tropical Pacific Ocean, had higher temperature departures.

I'm out of rep again, as is typical these days, but your map/global view shows the significance of anecdotal contradictions to patterns. Note the 'blue trough' over nearly the entirety of Alaska.

We were still having wind storm and snow blizzards here about a week ago, whereas over the last handful of years, our extremes in April were in the other direction, seeing us in the 80s while still in April.

(I playfully furthered a loose belief in Yin & Yang as it relates to seasonal weather those years, predicting that when we had outrageously warm springs, our summer would suck. I was frighteningly correct most of the time, despite the analogy beginning as a bit of a game).

We've now gone from a bizarre 'winter that wouldn't end' (that had long-time friends in the bush who've been here almost as long as I have, expressing depression and hopelessness on a fairly regular basis, as their wood sheds went lower and lower), to an overnight (literally) warming, that has had us in the mid to upper 50s, with LOTS of snow on the ground, resulting in what is becoming, and will become, the quagmire from Hell.

Pretty daunting to observe the fickle nature of Nature.

End point being that anecdotal observations are just that; anecdotal. The global view, long term patterns, and the SPEED with which changes occur are telling. It's not that the Earth has never cooled or warmed before; it's more the speed with which changes have occurred, and the extremes in variables; temps, humidity, duration of seasons, etc.

Happy mud season. Bad time to have dogs with long hair between their toes. Mops, by any other name...
 

trichrider

Kiss My Ring
Veteran
i've been watching your area moose, and thank you for expressing a feeling of yin and yang-ebb and flow-cyclical variation in your anecdotal observations.

i hope with your internet connection you are able to view the 2 videos i have queued up.

https://www.youtube.com/watch?v=8455KEDitpU

[youtubeif]8455KEDitpU[/youtubeif]
Tony Heller shows the fraud of climate graphs.
this is not the hottest/warmest of record.

https://www.youtube.com/watch?v=QVeusrlEqjM]

[youtubeif]QVeusrlEqjM[/youtubeif]
Gregg Braden in unrelated way verifies that cycles identify epochs in history where temperatures and CO2 content were much higher than this era. pay particular attention to the solar cycle graph at about the 26 min. mark...

fascinating how they put "blackface" on humanity as the real cause is hidden.

btw, did you catch any lake trout when ice-fishing?
 

trichrider

Kiss My Ring
Veteran
can't refute his content...call him crazy. nothing new about that.
article is a typical smear, i watched the cspan streaming of that presentation when it happened...the senate panel was very rude and dismissive of his claims, as was the idiot purporting to be a farmer who tried to physically attack Heller and had to be restrained by the sergeant-at-arms...unfortunately these people make the laws we must abide.
 

trichrider

Kiss My Ring
Veteran
Cold Air Rises. What That Means for Earth’s Climate. The Lightness of Water Vapor Buffers Climate Warming in the Tropics
By Kat Kerlin on May 6, 2020 in Environment

A typhoon moves over the sea in Thailand. Without the lightness of water vapor, the impacts of climate change to the tropics would be far worse, a UC Davis study found. (Getty)

Conventional knowledge has it that warm air rises while cold air sinks. But a study from the University of California, Davis, found that in the tropical atmosphere, cold air rises due to an overlooked effect — the lightness of water vapor. This effect helps to stabilize tropical climates and buffer some of the impacts of a warming climate.

The study, published today in the journal Science Advances, is among the first to show the profound implications water vapor buoyancy has on Earth’s climate and energy balance.

“It’s well-known that water vapor is an important greenhouse gas that warms the planet,” said senior author Da Yang, an assistant professor of atmospheric sciences at UC Davis and a joint faculty scientist with Lawrence Berkeley National Laboratory. “But on the other hand, water vapor has a buoyancy effect which helps release the heat of the atmosphere to space and reduce the degree of warming. Without this lightness of water vapor, the climate warming would be even worse.”

Humid air is lighter than dry air under the same temperature and pressure conditions. This is called the vapor buoyancy effect. This study discovered this effect allows cold, humid air to rise, forming clouds and thunderstorms in Earth’s tropics. Meanwhile, warm, dry air sinks in clear skies. Earth’s atmosphere then emits more energy to space than it otherwise would without vapor buoyancy.
cartoon_yang1-375x289.jpg


This graphic illustrates the vapor buoyancy effect, in which cold, humid air rises because it is lighter than dry air. (Da Yang/UC Davis)


The study found that the lightness of water vapor increases Earth’s thermal emission by about 1-3 watts per square meter over the tropics. That value compares with the amount of energy captured by doubling carbon dioxide in the atmosphere. The authors’ calculations further suggest that the radiative effects of vapor buoyancy increase exponentially with climate warming.


A better understanding of the vapor buoyancy effect and its stabilizing role in the tropics can also improve cloud and thunderstorm simulations, as well as climate models, the study said.


“Now that we understand how the lightness of water regulates tropical climate, we plan to study whether global climate models accurately represent this effect,” said the study’s lead author, Seth Seidel, a graduate student researcher at UC Davis


The study was funded by the David and Lucille Packard Foundation and the U.S. Department of Energy.


https://www.ucdavis.edu/news/cold-air-rises-what-means-earths-climate
 

igrowone

Well-known member
Veteran
so much virus news
here's something to cheer us up, warmer temperatures!
2nd warmest April in the record, just another data point on the trend line

Monthly Temperature: April 2020

During April 2020, warmer-than-average temperatures were present across much of the global land and ocean surfaces. The most notable warm temperature anomalies were present across much of northern Asia, where temperatures were 4.0°C (7.0°F) above average or higher. Other notable warm areas include western Australia, central Europe, the Gulf of Mexico, the Labrador and Bering seas, and across parts of the northern and southern Pacific Ocean and Antarctica, where temperature departures were +2.0°C (+3.6°F). Meanwhile, the most notable cool temperature departures of -2.0°C (-3.6°F) or cooler were present across much of Canada and the eastern contiguous U.S.

April 2020 Blended Land and Sea Surface
Temperature Anomalies in degrees Celsius


April 2020 Blended Land and Sea Surface
Temperature Percentiles

Record-warm April surface temperatures were present across parts of the Atlantic Ocean, Mexico, the Gulf of Mexico, northern South America, Africa, northern Asia, as well as parts of the Indian and western Pacific oceans. Overall, April 2020 had 6.87% of the world's land and ocean surfaces with a record high April temperature since records began in 1951. This was the fourth highest percentage of record warm April temperatures of that era. Only Aprils of 2016 (14.5%), 2010 (9.7%), and 1998 (7.9%) had a higher percentage. No land or ocean areas had record cold April temperatures.
Averaged as a whole, the global land and ocean surface temperature for April 2020 was 1.06°C (1.91°F) above the 20th century average of 13.7°C (56.7°F) and the second highest April temperature in the 141-year record. Only April 2016 was warmer at +1.13°C (+2.03°F). The eight warmest Aprils have occurred since 2010. April 2016 and 2020 were the only Aprils that had a global land and ocean surface temperature departure above 1.0°C (1.8°F). The April 2020 value is also tied with December 2019 as the 11th highest monthly temperature departure in the 1,684-monthly record. April 2020 also marked the 44th consecutive April and the 424th consecutive month with temperatures, at least nominally, above the 20th century average.
 

Latest posts

Latest posts

Top