POTENCY
YIELD
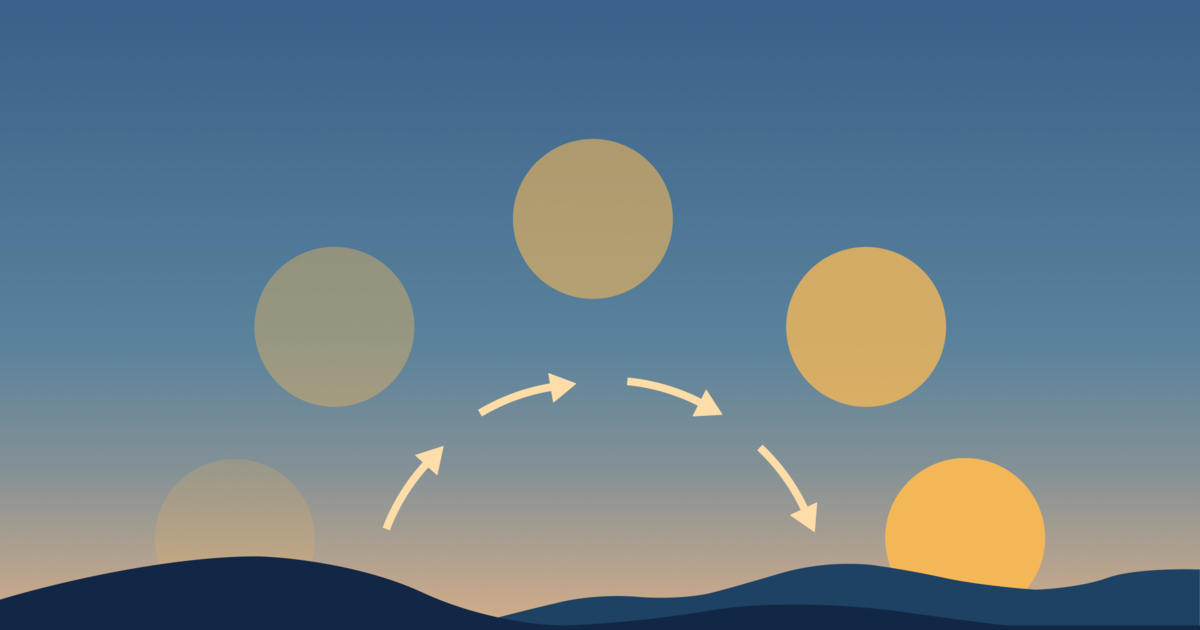
DURATION
CHEMO-TYPE COMPLEXITY
FLOWER MATURITY TYPE ALT PHYLLOTAXY
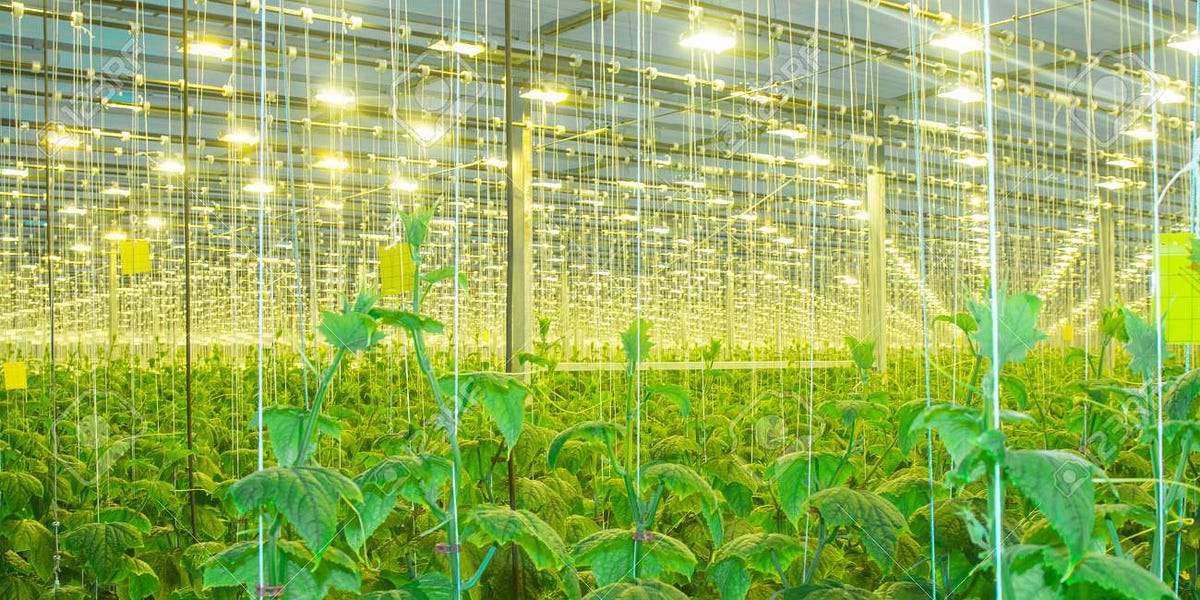
INDOOR VS OUTDOOR MORPHOLOGY
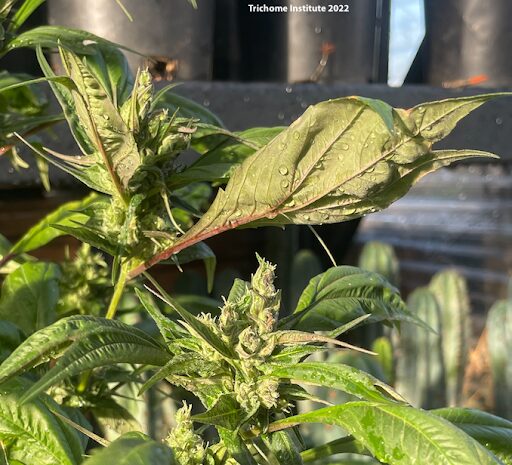
PERFECTLY IMPERFECT
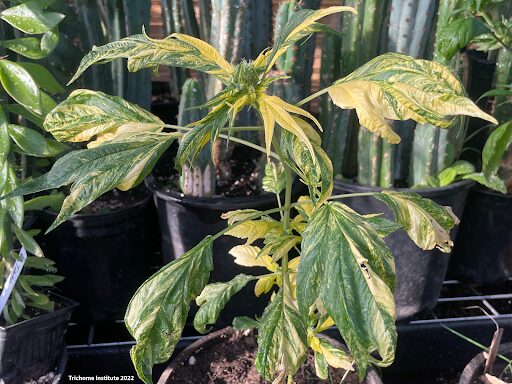
NOVELTY
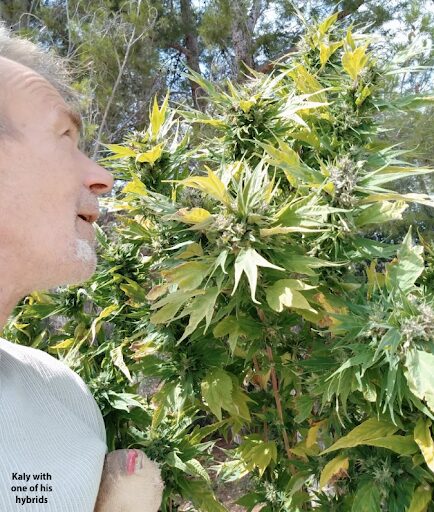
WILD
YIELD
DURATION
CHEMO-TYPE COMPLEXITY
FLOWER MATURITY TYPE ALT PHYLLOTAXY
INDOOR VS OUTDOOR MORPHOLOGY
PERFECTLY IMPERFECT
NOVELTY
WILD

 thanks


 Pin It
 Pin It
 Pin It
 Pin It