What's new
  • As of today ICMag has his own Discord server. In this Discord server you can chat, talk with eachother, listen to music, share stories and pictures...and much more. Join now and let's grow together! Join ICMag Discord here! More details in this thread here: here.

Have you looked at the North Pole lately?

CannaZen

Well-known member
hotter, colder, hotter, colder. seems to just be moving faster. we can agree on that. friction causes heat? could be the core of the planet but cars and combustion/exhaust. but that, the core, i realized the core of earth could be said to be an core of the sun in terms of geomagnetism (i think?)
 
Last edited:

trichrider

Kiss My Ring
Veteran
Friday, December 29, 2023

US claims huge portion of the ocean floor, from the Gulf of Mexico to the Arctic

Uriel Araujo, researcher with a focus on international and ethnic conflicts
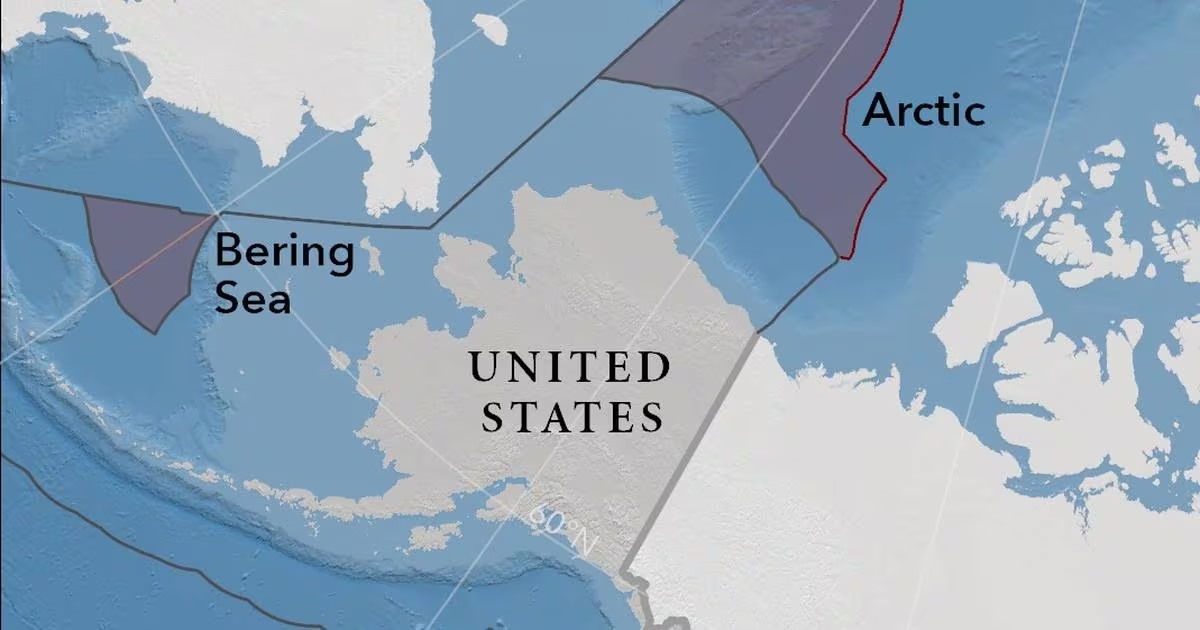
In an underreported but hugely important development, the United States is now claiming a vast portion of the ocean floor, twice the size of California. According to the US Department of State (DOS) Media Note released on December 19, the area “is approximately one million square kilometers spread across seven regions” and “holds many resources.”
According to the DOS, it “released the geographic coordinates defining the outer limits of the U.S. continental shelf in areas beyond 200 nautical miles from the coast, known as the extended continental shelf (ECS).” The mapping was also carried out by the US ECS Task Force (an American interagency body comprising14 agencies).
The data collection pertaining to this initiative, supposedly “the largest offshore mapping effort” ever conducted by Washington, actually started in 2003, and involved the National Oceanic and Atmospheric Administration (NOAA) and U.S. Geological Survey (USGS).
According to the DOS Executive Summary titled “The Outer Limits of the Extended Continental Shelf of the United States of America” (page 13), the Atlantic superpower has “maritime boundaries” or “unresolved” boundaries pertaining to the so-called “extended continental shelf” (ECS) with the following “neighboring countries”: Mexico, Cuba, the Bahamas (Atlantic region), Japan (Mariana Islands Region), and Russia (Arctic and Bering Sea Region), Canada (in the Arctic and Atlantic regions).
Albeit an explosive announcement as it is, as of today, one will have a hard time even finding news pieces on this development, with the exception of Bloomberg, Telesur, and a few others. It has immense political and geopolitical potential repercussions, though. The US not only got bigger, territory-wise, now, from Washington’s perspective: this is about claiming sovereignty rights in resource-rich areas where one could find the so-called “critical minerals” needed for renewable energy projects, deemed “key national security concerns” by Joe Biden’s administration, as Bloomberg journalist Danielle Bochove writes. According to U.S. Naval War College Professor James Kraska, these American shelf area claims highlight US strategic interests in securing such hard minerals to esure “American economic prosperity and national security.”
The unilateral claims, which can only be described as a bold territorial grab, include also the Bering and the Arctic Sea, where the Russian Federation, as well as other states, also have claims. The Department of State’s announcement comes without significant diplomatic talks with other actors or bilateral agreements, and without filing a claim through any relevant United Nations (UN) structures, for that matter, in a clear defiance of the “rules-based” global order by which Washington allegedly abides. Ironically, the US justifies such wide aspirations by referring to the 1982 United Nations Convention on the Law of the Sea (UNCLOS) which Washington itself has never ratified.
Mead Treadwell, former lieutenant governor of Alaska (who was also the 2006-2010 Chair of the US Arctic Research Commission) urges Washington to ratify it or else issues could arise: “it’s a problem if somebody challenges us who believes they’re got other rights to the same land.” One cannot highlight enough the fact that the enormous territory now claimed by the US extends all the way to the Arctic, an area deemed strategic by Russia - and China also has plans for the region, describing itself as “a state near the North Pole”.
Russian authorities unsurprisingly have criticized the American announcement. Grigory Karasin, chair of the Federation Council Committee on Foreign Affairs, has responded by stating that “we have taken and will continue to take all measures that are necessary for our national interests in this geographical area.” Similarly, Nikolai Kharitonov, head of the State Duma Committee on the Arctic, said that unilaterally expanding boundaries on this area is “unacceptable” and could lead to “increased tension”. In April 2021 I wrote on how NATO’s plans to militarize the Arctic were a source of tension with Moscow - and now this is exponentially boosted by American unilateral territorial expansion.
Much has been written about the space race as a new arena for geopolitical dispute - outer space being understood as the “new sea”. Well, similar considerations may apply to the continental shelf and the deep sea itself, with its unexplored resources and fauna, plus a troublesome lack of nomos (lawlessness) pertaining to mining and, more seriously, to territorial and sovereignty claims, as we have seen.
The issue has more than one angle, this also being yet another dramatic instance of the US overall “encircling” of Russia, which, by the way, also materializes itself in the so-called “NATOization” of Europe: Finnish and Swedish NATO bids, for one thing, result in extending the Atlantic Alliance’s territorial reach as far out as the Russian eastward Arctic flank, thus making Russia the only non-NATO state in the Arctic.
The ongoing Washington proxy attrition war in Ukraine against Moscow, as former US ambassador to Finland Earle Mack has described it, might very well be coming to an end with a soon-to-come land-for-peace deal (after the US elections, presumably) - but, as we can see, there is now a vast universe of potential future conflict unleashed by the latest American ocean floor territorial claims.
 

trichrider

Kiss My Ring
Veteran
Download PDF

Open AccessArticle

Equilibrium Climate after Spectral and Bolometric Irradiance Reduction in Grand Solar Minimum Simulations​

1
ISPRA—Italian Institute for Environmental Protection and Research, 00144 Rome, Italy
2
NORCE—Norwegian Research Center AS, 5008 Bergen, Norway
3
Department of Meteorology, University of Stockholm, 10791 Stockholm, Sweden
4
Bjerknes Center for Climate Research, 5007 Bergen, Norway
5
NILU—The Climate and Environmental Research Institute, 2007 Kjeller, Norway
6
Department of Physics, Norwegian University of Science and Technology, 7491 Trondheim, Norway
*
Author to whom correspondence should be addressed.
Climate 2024, 12(1), 1; https://doi.org/10.3390/cli12010001
Submission received: 29 September 2023 / Revised: 16 November 2023 / Accepted: 21 November 2023 / Published: 19 December 2023
(This article belongs to the Section Climate Dynamics and Modelling)
Download keyboard_arrow_down
Browse Figures

Versions Notes
Article Views 971

Abstract​

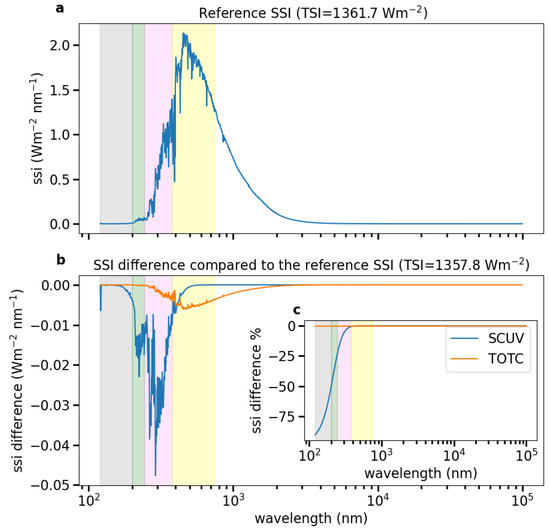
In this study, we use the Whole Atmosphere Community Climate Model, forced by present-day atmospheric composition and coupled to a Slab Ocean Model, to simulate the state of the climate under grand solar minimum forcing scenarios. Idealized experiments prescribe time-invariant solar irradiance reductions that are either uniform (percentage-wise) across the total solar radiation spectrum (TOTC) or spectrally localized in the ultraviolet (UV) band (SCUV). We compare the equilibrium condition of these experiments with the equilibrium condition of a control simulation, forced by perpetual solar maximum conditions. In SCUV, we observe large stratospheric cooling due to ozone reduction. In both the Northern Hemisphere (NH) and the Southern Hemisphere (SH), this is accompanied by a weakening of the polar night jet during the cold season. In TOTC, dynamically induced polar stratospheric cooling is observed in the transition seasons over the NH, without any ozone deficit. The global temperature cooling values, compared with the control climate, are 0.55±0.03
K in TOTC and 0.39±0.03
K in SCUV. The reductions in total meridional heat transport outside of the subtropics are similar in the two experiments, especially in the SH. Despite substantial differences in stratospheric forcing, similarities exist between the two experiments, such as cloudiness; meridional heating transport in the SH; and strong cooling in the NH during wintertime, although this cooling affects two different regions, namely, North America in TOTC and the Euro–Asian continent in SCUV.
Keywords:
solar activity; climate change projections; global models


1. Introduction​

The main source of energy for the Earth’s climate is solar irradiance, which can be expressed as a function of solar spectral irradiance (SSI, measured in W·m−2·
nm−1) or as total solar irradiance (TSI, measured in W·m−2
). TSI is the spectral integral of SSI over all wavelengths at the top of the Earth’s atmosphere when the Earth is at a base mean distance from the Sun (i.e., one astronomical unit). The TSI value follows the 11-year solar cycle, but in fractional terms, TSI variations are generally small, of the order of 0.1%. However, SSI exhibits much higher variability in some parts of the electromagnetic spectrum. In the visible and near-infrared spectra, the relative solar cycle amplitude is of the same order as that of TSI (0.1%), whereas in the ultraviolet (UV) spectrum, and the amplitude is up to 20% in specific spectral bands [1,2,3,4,5]. Specifically, Ref. [6] found interannual variability of approximately 15% in the band 100–200 nm during the spacecraft era.
Radiative fluxes in different spectral bands have a profoundly distinct influence on the terrestrial atmosphere. On the one hand, UV radiation has a strong impact on the stratospheric ozone distribution, and it is mostly absorbed in the upper stratosphere, where the associated heating provides vertically stable thermal stratification. On the other hand, visible radiation, which represents most of the incoming radiation, is predominantly absorbed at the surface, with a smaller proportion being absorbed and reflected by clouds. Past observations of sunspot numbers serve as a proxy for solar activity, and they suggest more marked solar variations than those observed in recent solar cycles [7,8,9,10,11]. Prolonged periods of past low solar activity [12] are the Maunder Minimum (MM) in the late 17th and early 18th centuries and the Dalton Minimum, a period of low solar activity from 1790 to 1830.
The MM extended over several decades and was characterized by cold conditions [13], during which the sunspot number was consistently low [14]. Solar irradiance is, therefore, assumed to have reached the lowest values of the past millennium during the MM [15]. In particular, Ref. [16] retrieved, between 1650 and 1750, a minimum value comparable with that in [8]. Temperature reconstructions, based on indices derived from documentary evidence (before 1750) and on instrumental data thereafter, show a temperature drop of approximately 1.5 K in the European region compared with 30-year modern-day averages (1975–2004) and a drop of approximately 1 K compared with averages in the 20th century [17], a result confirmed in [18]. The available observational evidence indicates a prevalence of frosty winters, rather than cool summers, and an inferred geographic prevalence of such cold conditions in the North Atlantic and western Eurasia [19]. The cooling over Europe has been proposed to be due to a change in the distribution of Euro–Atlantic blocking events and a subsequent reduction in the mid-latitude westerlies [20], a hypothesis further supported by [21] through analyses of logbooks from ships crossing the Atlantic Ocean.
The actual TSI value during the MM, as well as the associated SSI distribution, remains unknown, as the solar variability at centennial or longer time scales is notoriously difficult to constrain. Thus, different reconstructions of TSI values have been used in the past, with decreases ranging from less than 0.1% to 0.4% [8,9,22,23]. The latter value, suggested by [8], has been criticized to be an unrealistically strong reduction [24]. Likewise, SSI changes in model studies of the MM or of a hypothetical future MM-like Grand Solar Minimum (GSM) are diverse [25,26]. An extrapolation of the observed variability during recent solar cycles would translate into relatively weak changes in UV SSI of the order of a few tenths of a percent. By contrast, Ref. [27] suggested a reduction of 9% in the 180–250 nm band during the MM, and Ref. [8] indicates an even more pronounced reduction, 26%, in the Schumann–Runge UV band, 175–200 nm. Refs. [7,28] similarly suggested an MM reduction of up to 30% in the 150–300 nm band.
The radiative forcing terms arising from such variations in the incoming solar radiation are often so small that their effects on the atmospheric circulation may not be easily distinguished from free fluctuations in the climate system [29]. Nevertheless, two main conceptual mechanisms, often described as the “top-down” and “bottom-up” mechanisms, respectively, have been proposed to describe how small solar irradiance variations can be amplified and result in significant influences on the climate [30,31,32]. The bottom-up mechanism is caused by the absorption of visible radiation at the surface and involves atmosphere–ocean interactions and the hydrological cycle at low latitudes, whereas the top-down mechanism is caused by the absorption of UV radiation by ozone in the stratosphere, resulting in dynamical anomalies that propagate poleward and downward into the troposphere through wave–mean–flow interactions [33,34].
The variability in UV solar irradiance throughout an 11-year solar cycle likely has a limited effect on global surface temperatures (for example, in [35]). Nevertheless, the top-down pathway has been linked to regional changes in temperature and surface pressure over the Euro–Atlantic sector that project onto the North Atlantic Oscillation [36,37,38], as well as over the North Pacific sector [39].
Several studies have further looked at how these two mechanisms might affect the atmospheric circulation and the global surface temperatures during a future GSM [24,40,41,42,43,44,45]. These studies suggest that, while a grand minimum could potentially cool the planet by up to 0.3 K, its impact would, at best, only decelerate anthropogenic global warming without completely reversing it. Ref. [41] identified a more significant role of the reduction in visible radiation in transient simulations. Nevertheless, in their conservative reduction scenario, which was based on averaged minima over the last few solar cycles, the imposed UV decrease was relatively small, approximately 0.03%. Refs. [43,45] employed larger reductions, reaching about 6%, of the UV solar spectral irradiance (SSI), in their transient simulations. They observed that the top-down mechanism played a crucial role in inducing regional cooling anomalies at high northern latitudes during winter and spring. Another study [8] proposed a substantial reduction in UV SSI, up to 15%, and this reduction was applied in simulations conducted by [40,46,47]. In their transient simulations replicating Dalton and Maunder-like solar minima, Refs. [40,48] argued that the intensified top-down mechanism resulted in pronounced Arctic cooling.
Previous studies (for example, [31]) had attempted to assess the respective roles of top-down and bottom-up mechanisms using a suite of coupled and uncoupled simulations (i.e., low-top without interactive chemistry, high-top with or without ocean coupling). However, these studies tended not to cleanly separate the forcings themselves. For instance, Refs. [1,49] applied large reductions in solar spectral irradiance (SSI) in the UV band or at shorter wavelengths, but also implemented a substantial reduction, in absolute terms, in the visible range.
In this study, we do not address the potential role that volcanic eruptions might have played since our objective is to evaluate the impacts of irradiance reductions associated with a GSM under present-day climate conditions. Given the array of reconstructions of solar forcing during the Maunder Minimum (MM) era and the uncertainties associated with them, in this paper, we consider that the UV Solar Spectral Irradiance (SSI) deficit during the MM, or in a hypothetical future GSM, is not well constrained and might be substantial. Our main interest is in exploring the potential sensitivity of the climate to a large SSI reduction in the UV band compared with the effect of a uniformly varying SSI reduction (but corresponding to the same Total Solar Irradiance (TSI) change) during a hypothetical future GSM. Our experimental design, using only a single model, allows us to distinguish the respective roles of UV and visible band reductions more clearly than in previous studies (for example, [40,49], in the context of a GSM).
To address our objective, we run a high-top atmospheric model with interactive ozone chemistry coupled to a mixed–layer ocean. Our uniform and spectrally varying SSI perturbations are described in Section 2, and Section 3 highlights the key results before we draw some main conclusions in Section 4.

4. Conclusions​

We investigated the role of solar irradiance reduction indicative of a GSM on the Earth’s climate at equilibrium, with a focus on the NH. The TSI reduction associated with past solar minima, such as during the MM or the Dalton minimum, likely involved a substantial decrease in SSI in the UV bands. We assessed the seasonal-mean responses to idealized spectral and bolometric irradiance reductions with distinct curtailments in the visible and UV bands in two 100-year-long fixed-forcing simulations, with 20 years used for spin-up. We employed a SOM coupled to a “high-top” atmospheric model (WACCM) featuring interactive chemistry. The results were compared with those from a control experiment representative of solar maximum conditions (CNTRL). All experiments had an atmospheric composition corresponding to present-day climate. The applied TSI reduction (0.0285%) was chosen to be sufficiently large so that both perturbed experiments would exhibit climate responses clearly discerned from internal variability. Moreover, we designed the sensitivity experiments to clearly separate the influence of the UV band from that of the visible band, even though complete separation would be nonphysical. In the first experiment, the irradiance reduction was mainly restricted to the UV part of the spectrum (SCUV), while in the second experiment (TOTC), the irradiance percentage-wise reduction was applied uniformly across all spectral bands.
SCUV showed little change in the visible radiation entering the atmosphere (0.37 W·m−2
), unlike TOTC which had 1.86 W·m−2. However, the atmosphere is transparent to the part of the UV spectrum close to the visible band, favoring the “bottom-up” mechanism. In fact, the reduction in the UV-A plus visible bands is 2.02 W·m−2 in TOTC and 1.36 W·m−2
in SCUV. This would justify the difference in the 2 m temperature without invoking a top-down mechanism. TOTC shows a global 2 m temperature reduction larger than SCUV (0.51 K and 0.39 K, respectively). The patterns of temperature reductions are quite different, especially in the NH, where SCUV exhibits the strongest reduction over the Euro–Asian region, while TOTC exhibits the strongest reduction over North America. Ref. [49] performed two similar experiments with a reduction in TSI of 0.25% and found almost the same change in global 2 m temperature in both the experiments (0.56 K and 0.55 K for their total and spectral reduction experiments), likely due to a large overlap of reduced spectral power in the visible band.
Although SCUV and TOTC share some commonalities when compared to CNTRL, such as increasing low-level cloudiness, a reduction in global precipitation and MHT at mid-latitudes, there are, however, some important differences.
  • TOTC receives lower values of incoming radiation at the surface than SCUV. In TOTC, there is an absolute minimum MHT difference in the NH tropical region, suggesting that tropical regions not only receive less heat but are also unable to transport it poleward, even though, in this experiment, there is a higher thermal gradient caused by strong polar cooling. MHT differences are small but significant. The low values of MHT differences between SCUV, TOTC and CNTRL do not come as a surprise. Ref. [65] showed that MHT is nearly invariant in an ensemble of experiments spanning from the last glaciation to a world with CO2 quadrupled above the pre-industrial situation.
  • The difference in cloudiness among the experiments shows that the presence of feedback may also change the differential response. SCUV shows many more high clouds that reduce absorbed shortwave radiation by increasing the planetary albedo, as also shown by [71]. At the same time, they may contribute to warming the planet, whereas TOTC has more low clouds, which have a cooling effect on the climate as they increase outgoing longwave radiation. Low clouds over SH oceans would also play a role in the teleconnection between mid-latitudes and the tropical region [70];
  • TOTC exhibits polar amplification in the Arctic region that cools the planet because of more ice fraction compared to CNTRL and SCUV. This larger cooling of the NH has consequences for the tropics as the HC and ITCZ are, in some way, correlated with cross-equatorial energy transport.
One of the points of debate on the influence of solar activity on climate has been over the so-called “bottom-up” and “top-down” mechanisms. Our results suggest that the “bottom-up” mechanism is prevalent not only under TOTC condition but even under SCUV conditions, confirming the results by [72], which used a more complex suite of experiments with different models. Moreover, SCUV shows that the UV reduction would make Earth’s climate warmer than TOTC, not only because of more shortwave arriving at the surface, but also because of high cloud feedback.
A few limitations of the present study need to be discussed briefly. The use of long periods with low TSI is a hypothesis needed to study the model response under those conditions. We also used Kp = 3 and Kp = 7 as extreme values associated with our minimum and maximum TSI. Both TSI and Kp in reality change continuously. In particular, TSI normally follows a 11-year cycle, and it is supposed to have a small impact, compared with the relatively long periods of a quiet Sun. The model uses the present atmospheric composition and does not aim to replicate past climate. As mentioned earlier, other studies have investigated the role of future climate with an increase in CO2
, so the amount of CO2
may be crucial in determining the impact on the temperature due to TSI reduction. The reconstruction of TSI and SSI is limited to that of Lean [1]. As shown in [73] there are twenty TSI reconstructions, and they may give conflicting results.
In this study, we have attempted to raise the awareness of the importance of UV solar irradiance as a climate forcing mechanism. There are still large uncertainties associated with the temporal evolution of UV irradiance over the last millennium, but new novel proxies for surface UV-B irradiance, based on the chemistry of pollen grains, are currently being developed [74]. Future research should, therefore, aim to combine such novel proxies, with coupled high-top climate models, incorporating fully interactive chemistry. Together, such measures will help further advance our understanding of how variations in solar UV irradiance may impact the climate system, both in past and possible future climates.


who'd a thunk?
 

trichrider

Kiss My Ring
Veteran

Development of wavelet-based machine learning models for predicting long-term rainfall from sunspots and ENSO​


Volume 14, article number 5, (2024)

Download PDF You have full access to this open access article

Applied Water Science


Abstract​

The variations in rainfall and its spatial and temporal distribution in wet and dry seasons have increased substantially globally owing to the effect of climate change. These disparities can lead to droughts and severe water shortages, as exemplified by the unprecedented drought in Taiwan in 2021, which is considered the worst in 50 years. From a broader perspective, the overall climate and water resources on Earth are influenced by factors, such as the El Niño phenomenon and solar activity. Accordingly, this study examines the relationship between rainfall and planetary- or large-scale influencing factors, such as sunspots and the El Niño-Southern Oscillation. Additionally, rainfall patterns under various conditions are predicted using machine learning models combined with wavelet analysis. These models use 60-years historical data to build models, and the Bayesian network model exhibited the best overall prediction accuracy (85.7%), with sunspots emerging as the most influential factor. The novel findings of this study strongly confirmed that the relationship between sunspot and local rainfall patterns can serve as a valuable reference for water resources management and planning by relevant organizations.

...........

Conclusion​

This study employed a novel data-driven approach to investigate the time–frequency relationships between sunspot and long-term local rainfall amount, and constructed machine learning prediction models to confirm the effect of solar activity on long-term local rainfall patterns. The results demonstrated that improved prediction results were achieved in relatively rainy areas. This could be attributed to the possible influence of extreme weather events, such as typhoons, on rainfall in other areas, and the inability to directly incorporate specific rainfall patterns associated with typhoons into this model to establish a connection with sunspot activity and the ENSO effect. In addition, the results revealed that the relationship between sunspots and local rainfall in Taiwan is increasing yearly, regardless of space or time; particularly, this was more notable in 1990, which was set as the boundary.
These results indicated that rainfall behavior (except extreme rainfall caused by typhoon) can be described using sunspots and ENSO effect, and this will be beneficial for providing water resource management. Although the impact of direct sunspots on rainfall may not be significant, the wavelet extraction indicated that it is one of the most influential features, and its impact exceeded that of humidity, which is typically believed to exert the greatest impact on rainfall. Therefore, we recommend that indicators of planetary-scale solar activity, such as sunspots, should be incorporated in future long-term water resource management or predictions, as it has been confirmed in this study as an important factor influencing regional rainfall on larger timescales, and is even more significant than the El Niño phenomenon and humidity.


arsekick

Well-known member
1704009540286.png
 

trichrider

Kiss My Ring
Veteran
off topic but incredibly interesting experiments and results in physics.
these guys have been working on a device that trans-mutates radioactive elements into benign elements.
it's been called the SAFIRE Project.
take a look:


I'm blown away!

ps Igrowone, if you want it removed let me know:abduct:
 

igrowone

Well-known member
Veteran
off topic but incredibly interesting experiments and results in physics.
these guys have been working on a device that trans-mutates radioactive elements into benign elements.
it's been called the SAFIRE Project.
take a look:


I'm blown away!

ps Igrowone, if you want it removed let me know:abduct:

no this is fine, there's a tie in to energy, and energy is very relevant to the thread
 

trichrider

Kiss My Ring
Veteran

1704313795099.png
 

trichrider

Kiss My Ring
Veteran

Sweden Records Coldest January Evening in 25 Years​


3 Jan 2024
2:48


COPENHAGEN, Denmark (AP) – Europe experienced stark weather contrasts on Wednesday, with extreme cold and snowstorms disrupting transportation and closing schools in Scandinavia while strong winds and heavy rain in western Europe caused flooding and at least one death.
Temperatures fell below minus 40 degrees Celsius (minus 40 degrees Fahrenheit) in the Nordic region for a second day in a row Wednesday. In Kvikkjokk-Årrenjarka in Swedish Lapland, the mercury dropped to minus 43.6 C (minus 46.5 F), the lowest January temperature recorded in Sweden in 25 years, Sweden’s TT news agency reported.
Extremely cold temperatures, snow and gale-force winds disrupted transportation throughout the Nordic region, with several bridges closed and some train and ferry services suspended. Several schools in Scandinavia were closed.

I wonder if this was/is a result of the weakening/distortion of the polar vortex predicted last week.
 

Chi13

Well-known member
ICMag Donor


The highest temperature ever recorded in Australia is 50.7 °C (123.3 °F), which was recorded on January 7, 1906 at Mildura, Victoria and 2 January 1960 at Oodnadatta, South Australia, and 13 January 2022 at Onslow, Western Australia. The lowest temperature ever recorded in Australia is −23.0 °C (−9.4 °F), at Charlotte Pass, New South Wales, on 29 June 1994.

Highest temperatures recorded in Australia[edit]​


Temperature[1]State or territoryLocationDate recorded
50.7 °C (123.3 °F)South AustraliaOodnadatta2 January 1960
Western AustraliaOnslow[2]13 January 2022
50.5 °C (122.9 °F)Western AustraliaMardie Station[2]19 February 1998
13 January 2022
Roebourne[2]13 January 2022
50.3 °C (122.5 °F)South AustraliaOodnadatta3 January 1960
50.1 °C (122.2 °F)New South WalesWilcannia11 January 1939
49.9 °C (121.8 °F)South AustraliaNullarbor19 December 2019
49.8 °C (121.6 °F)Western AustraliaMundrabilla Station3 January 1979
Forrest13 January 1979
Emu Creek Station21 February 1998
Eucla19 December 2019
49.7 °C (121.5 °F)New South WalesMenindee10 January 1939
49.6 °C (121.3 °F)South AustraliaMoomba12 January 2013
49.5 °C (121.1 °F)QueenslandBirdsville24 December 1972
South AustraliaPort Augusta24 January 2019
Western AustraliaForrest19 December 2019
It was previously thought that the highest temperature in Australia was 53.1 °C (127.6 °F) in Cloncurry, Queensland, on 16 January 1889. This record has been removed by the Bureau of Meteorology though as it was measured using a non-standard temperature screen. It is believed that the temperature that day was most likely about 47 °C (117 °F).[3][4][5]
wiki
 
Last edited:

arsekick

Well-known member
Yeah no tnuc could read a thermometer before 1910 according to the BOM, and if they could the BOM adjusts them to pretend there was no hot weather before 1910 or after if it doesn't suit the "man made" warming narrative

Perth hottest day was 47c in the summer of 1977/8, but according to the BOM it was 44.5 in 1997, you can't believe anything they put out
 
Last edited:

Chi13

Well-known member
ICMag Donor
Yeah no tnuc could read a thermometer before 1910 according to the BOM, and if they could, the BOM adjusts them to pretend there was no hot weather before 1910 or after if it doesn't suit the "man made" warming narrative

Perth hottest day was 47c in the summer of 1977/8, but according to the BOM it was 44.5 in 1997, you can't believe anything they put out
Daily temps mean nothing and you always cherry pick. Penrith 2020, 48.9 C (118F).

Penrith in Sydney’s west was the hottest place on the planet yesterday with sweltering temperatures creeping up to 50C.
The city recorded its hottest ever day with the mercury reaching 48.9C at 3pm, while the Bureau of Meteorology recorded a high of 47.7C at 2pm.
Temperatures were set to stay above 40C until sunset just after 8pm.
 

arsekick

Well-known member
Daily temps mean nothing and you always cherry pick. Penrith 2020, 48.9 C (118F).

Penrith in Sydney’s west was the hottest place on the planet yesterday with sweltering temperatures creeping up to 50C.
The city recorded its hottest ever day with the mercury reaching 48.9C at 3pm, while the Bureau of Meteorology recorded a high of 47.7C at 2pm.
Temperatures were set to stay above 40C until sunset just after 8pm.
No surprise Penrith would get hot, the surprise is we are not setting record hot temps more often, every city on the globe should be setting record hot temps. how hot would Melbourne's 47.2 c in the 1850s be now with the "urban island heat effect"

1704332844752.png


About the only truth to it all is that its warmed up since the little ice age and its warmed up since the ice age scare of the 70s.

Why did it cool down in the 60/70/80s if Co2 causes warming ?


Its a scam
 
Top