What's new
  • As of today ICMag has his own Discord server. In this Discord server you can chat, talk with eachother, listen to music, share stories and pictures...and much more. Join now and let's grow together! Join ICMag Discord here! More details in this thread here: here.

Have you looked at the North Pole lately?

trichrider

Kiss My Ring
Veteran

Baseball-Sized Hail Wreaks Havoc on Million-Dollar 5.2 Megawatt Community Solar Project in Nebraska, Destroying Over 14,000 Solar Panels​

how would one rectify spraying to reduce sunlight while simultaneously moving towards solar panel farms? one should know that solar panels absorb heat, maybe we should ban solar panels.
 
Last edited:

igrowone

Well-known member
Veteran
the summer is waxing, and a summer to remember
no doubt some have noticed that we've seen some warm days
the warmest actually, last 4 days the warmest globally since records started being kept
but let us keep to the topic, the ice up north
here's what shaking in greenland, not so good

greenland_daily_melt_tmb.jpg
greenland_daily_melt_plot_tmb.jpg
 

Rgd

Well-known member
Veteran
the summer is waxing, and a summer to remember
no doubt some have noticed that we've seen some warm days
the warmest actually, last 4 days the warmest globally since records started being kept
but let us keep to the topic, the ice up north
here's what shaking in greenland, not so good

View attachment 18862599 View attachment 18862601
long ago.. there used to be green fields there....WEATHER on 700 year cycles?
 

St. Phatty

Active member
the summer is waxing, and a summer to remember
no doubt some have noticed that we've seen some warm days
the warmest actually, last 4 days the warmest globally since records started being kept
but let us keep to the topic, the ice up north
here's what shaking in greenland, not so good

View attachment 18862599 View attachment 18862601

Do the glaciers that got melted last year get "Re-filled" by all the snow over the winter ?

Or is the trend telling us that in X years, Greenland will be all land, no snow, in the summer, because all the glaciers ended up in the ocean ? ... and a little bit in the atmosphere as water vapor.
 

igrowone

Well-known member
Veteran
Do the glaciers that got melted last year get "Re-filled" by all the snow over the winter ?

Or is the trend telling us that in X years, Greenland will be all land, no snow, in the summer, because all the glaciers ended up in the ocean ? ... and a little bit in the atmosphere as water vapor.
that's the net mass balance, haven't posted those numbers but seems it might be a good idea with interest growing
 
  • Like
Reactions: LBL

igrowone

Well-known member
Veteran
from Copernicus.org, a overview paragraph for a complex topic


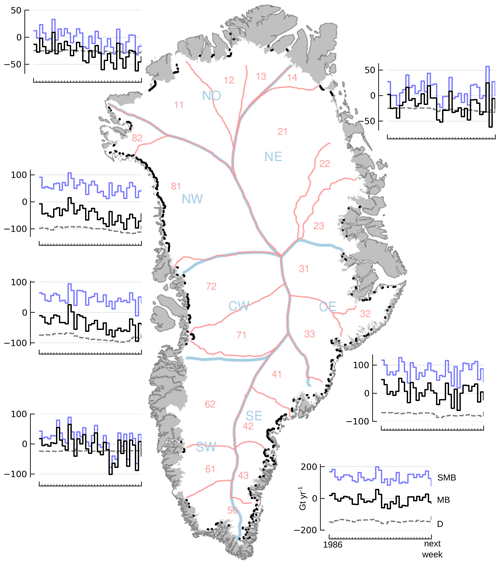
Over the past several decades, mass loss from the Greenland ice sheet has increased (Khan et al., 2015; IMBIE Team, 2019). Different processes dominate the regional mass loss of the ice sheet, and their relative contribution has fluctuated in time (Mouginot and Rignot, 2019). For example, in the 1970s nearly all sectors gained mass due to positive surface mass balance (SMB), except the northwestern sector, where discharge losses dominated. More recently, in the 2010s, all sectors lost mass, with some sectors losing mass almost entirely via negative SMB and others primarily due to discharge (Fig. 1).

https://essd.copernicus.org/articles/13/5001/2021/essd-13-5001-2021-f01
Figure 1Annual mass balance (black lines), surface mass balance (blue lines), and discharge plus basal mass balance (dashed grey) in Gt yr−1 for each of the seven Mouginot and Rignot (2019) regions. The map shows both the named regions (Mouginot and Rignot, 2019) and the numbered sectors (Zwally et al., 2012). Discharge gates are marked in black. Only recent (post-1986) data are shown because reconstructed data are not separated into regions or sectors. Next week is defined as 1 November 2021 based on the date this document was compiled.
 

igrowone

Well-known member
Veteran
and here's a picture that should be viewed with dread
but those that see the topic with disdain will see nothing
leading paragraph of NOAA's current antarctic analysis

The total ice extent in the Antarctic is continuing to track at extreme record low levels, with departures from the long-term average of more than four standard deviations. Sea ice extent is below average everywhere except in the northern Amundsen Sea where it is more extensive than average (Figure 6a). In the Indian Ocean sector, ice extent is near average to slightly below.

The dramatically slower pace of ice growth through the 2023 autumn and early winter is a topic of intense research.
S_iqr_timeseries.jpg
 

St. Phatty

Active member
and here's a picture that should be viewed with dread
but those that see the topic with disdain will see nothing
leading paragraph of NOAA's current antarctic analysis

The total ice extent in the Antarctic is continuing to track at extreme record low levels, with departures from the long-term average of more than four standard deviations. Sea ice extent is below average everywhere except in the northern Amundsen Sea where it is more extensive than average (Figure 6a). In the Indian Ocean sector, ice extent is near average to slightly below.

The dramatically slower pace of ice growth through the 2023 autumn and early winter is a topic of intense research. View attachment 18863132

Any idea on how many cubic miles of Antarctic and Greenland ice have ended up permanently in the ocean the last 50 years ?

What is the unit of measure that is used - acre feet ?
 

igrowone

Well-known member
Veteran
Any idea on how many cubic miles of Antarctic and Greenland ice have ended up permanently in the ocean the last 50 years ?

What is the unit of measure that is used - acre feet ?
a lot of research refers to mass losses in gigatons and Sea Level Rise(SLR) in mm
this from the GRACE satellite measurements

The mass of the Greenland ice sheet has rapidly declined in the last several years due to surface melting and iceberg calving. Research based on observations from the Gravity Recovery and Climate Experiment (GRACE) satellites (2002-2017) and GRACE Follow-On (since 2018 - ) indicates that between 2002 and 2021, Greenland shed approximately 280 gigatons of ice per year, causing global sea level to rise by 0.03 inches (0.8 millimeters) per year. These images, created from GRACE and GRACE-FO data, show changes in Greenland ice mass since 2002. Orange and red shades indicate areas that lost ice mass, while light blue shades indicate areas that gained ice mass. White indicates areas where there has been very little or no change in ice mass since 2002. In general, higher-elevation areas near the center of Greenland experienced little to no change, while lower-elevation and coastal areas experienced over 16.4 feet (5 meters) of ice mass loss (expressed in equivalent-water-height; dark red) over this 19-year period. The largest mass decreases occurred along the West Greenland coast. The average flow lines (grey; created from satellite radar interferometry) of Greenland’s ice converge into the locations of prominent outlet glaciers, and coincide with areas of highest mass loss. This supports other observations that warming ocean waters around Greenland play a key role in contemporary ice mass loss.
 

LBL

New member
from Copernicus.org, a overview paragraph for a complex topic


Over the past several decades, mass loss from the Greenland ice sheet has increased (Khan et al., 2015; IMBIE Team, 2019). Different processes dominate the regional mass loss of the ice sheet, and their relative contribution has fluctuated in time (Mouginot and Rignot, 2019). For example, in the 1970s nearly all sectors gained mass due to positive surface mass balance (SMB), except the northwestern sector, where discharge losses dominated. More recently, in the 2010s, all sectors lost mass, with some sectors losing mass almost entirely via negative SMB and others primarily due to discharge (Fig. 1).

https://essd.copernicus.org/articles/13/5001/2021/essd-13-5001-2021-f01
Figure 1Annual mass balance (black lines), surface mass balance (blue lines), and discharge plus basal mass balance (dashed grey) in Gt yr−1 for each of the seven Mouginot and Rignot (2019) regions. The map shows both the named regions (Mouginot and Rignot, 2019) and the numbered sectors (Zwally et al., 2012). Discharge gates are marked in black. Only recent (post-1986) data are shown because reconstructed data are not separated into regions or sectors. Next week is defined as 1 November 2021 based on the date this document was compiled.

Does the water in the ice move between the 2 ice masses - Greenland to Antarctica ?

For example, water mass lost in the summer in the Northern Hemisphere, somehow makes its way to Antarctica, who has winter when Greenland has summer ?
 

chilliwilli

Waterboy
Veteran
Does the water in the ice move between the 2 ice masses - Greenland to Antarctica ?

For example, water mass lost in the summer in the Northern Hemisphere, somehow makes its way to Antarctica, who has winter when Greenland has summer ?
I don't think that that ice that melts somehow magical appears on the other end of the world.
 

igrowone

Well-known member
Veteran
Does the water in the ice move between the 2 ice masses - Greenland to Antarctica ?

For example, water mass lost in the summer in the Northern Hemisphere, somehow makes its way to Antarctica, who has winter when Greenland has summer ?
they're well separated from each other, no means for it to happen
 

armedoldhippy

Well-known member
Veteran
one site describes it as "the Gulf Stream flows north flush with warm water going north nearly to the Arctic, where the warm water pushes the denser cold water down and it slowly flows back south along the depths of the Atlantic until reaching Antarctica". lots of maps showing the GS going north, but damn little showing a return stream... ?
 
Top