What's new
  • ICMag and The Vault are running a NEW contest! You can check it here. Prizes are seeds & forum premium access. Come join in!

climate change

Genghis Kush

Active member
http://www.theweathernetwork.com/ne...cap-record-low-after-record-hot-january/63907


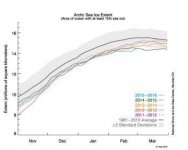
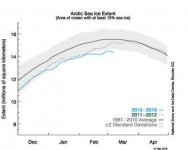
"Arctic sea ice at record low, Antarctic far below average

In January 2016 Arctic sea ice extent started off the new year by dropping to its lowest point on record, going back to 1979. This was due, at least in part, to Storm Frank, which was working its way up between Iceland, Ireland and the UK, and bringing plenty of heat and strong winds to the Arctic in the process.

With still a few months before spring and the typical winter peak of Arctic sea ice, there was plenty of time for the extent to reach more normal levels. Indeed, the amount of sea ice did grow again as the storm passed and temperatures through the Arctic returned to something more typical for this time of year.

As of February 1st, however, data from the US National Snow and Ice Data Center (NSIDC) showed that Arctic sea ice extent had, once again, dropped record low levels, and after briefly climbing above levels recorded back in 2005, they once again fell to record low levels as of February 11."
 

Waxman

Member
The oil and gas companies will make absolutely sure no one interrupts their cash flow with clean alternative energy.
 

trichrider

Kiss My Ring
Veteran
:laughing:
it didn't.

that record challenges your comprehension capabilities Genghis.

it is a record of the low MAXIMUM RECORD.

NOT an overall minimum record.


Newsroom
Media Advisory
19 March 2015

Arctic sea ice maximum reaches lowest extent on record

Arctic sea ice appears to have reached its maximum extent for the year on February 25 at 14.54 million square kilometers (5.61 million square miles).
This year's maximum ice extent is the lowest in the satellite record.

this is not the same as record minimum....and it is averaged, which prior low maximums would bias.


....and, satellite records only began in 2003.


Climate research is generally based on data collected for
other purposes, primarily for weather prediction. To make
these data useful for climate studies, it is usually necessary
to analyze and process the basic observational record to
create a Climate Data Record(CDR)

A CDR is a series
of observations over time that measures variables believed
to be associated with climate variation and change. These changes may be small
and occur over long time per
iods (seasonal, interannual, and decadal to centennial)
compared to the short-term changes that are monitored for
weather forecasting.
Thus, it is usually necessary to
construct a CDR from data that span long time scales
and
sometimes from multiple data sources. Scientists must
characterize and quantify the sensor, spatial and temporal errors of these diverse and

frequently large data sets in order to produce a sufficiently accurate time series for studying
trends in climate variability and change.


https://cimss.ssec.wisc.edu/itwg/gr...s_from_NOAA_Satellites_White_Paper_18_Aug.pdf
 

igrowone

Well-known member
Veteran
record low maximums, that's what's going on at the moment
yesterday's radar map showed no growth, no significant growth in February
which is way too early for it to stop, it may start back up again, but it hasn't yet
 

HempKat

Just A Simple Old Dirt Farmer
Veteran
Look I'll say it once again, Climate change is a given absolute fact. What is up for debate still is the cause of it. We know the earth goes thru cycles that bring about Ice Ages and during those times the climates change in many regions around the world. Then after time passes the climate changes back to what we would consider to be more normal/ So there is no doubt what so ever that Climate Change does occur on earth.

Where the confusion sets in stems from the fact that these cycles are so slow and so long that they extend beyond mankind's recorded history. We do have some slight understanding of these cycles however and from that projections have been made as to what changes should be occurring at what point. These projections though are imperfect and so it's possible for changes to happen sooner or later then we predict but these events happening sooner or later might also be the result of new variables into what brings about these changes. Therefore we try to come up with ways to explain these unexpected occurrences of climate change based on the assumption that our predictions of this natural cycle are accurate. Given that this natural cycle stretches over such a vast time period even slight inaccuracies in our understanding of the cycle could create major differences in our predictions compared to the event itself.

This leaves us with the result that Climate change is a fact but whether it is caused by man or not is just one possible theory.
 

Meraxes

Active member
Veteran
I dont even understand why this is still being debated. The right in America seem to be the only people on Earth still denying this...
 

barnyard

Member
the solution is to quit your day jobs and become eco warriors and eco worriorsess!!!

wooo! wooo! wooo! wooo! wooo!
 

Dropped Cat

Six Gummi Bears and Some Scotch
Veteran
Hopefully our ancestors will forgive us.

Unless its a hoax.

But what if its real.

picture.php


Turtle corsets, lol
 

Weird

3rd-Eye Jedi
Veteran
Here is the study I posted a while back

political slant even divides scientists

Meteorologists' views about global warming: A survey of American Meteorological Society professional members

http://journals.ametsoc.org/doi/abs/10.1175/BAMS-D-13-00091.1

Very important read if you want to understand bias in data, here are some snippets from it

While we found that higher expertise was associated with a greater likelihood of viewing global warming as real and harmful, this relationship was less strong than for political ideology and perceived consensus. At least for the measure of expertise that we used, climate science expertise may be a less important influence on global warming views than political ideology or social consensus norms. More than any other result of the study, this would be strong evidence against the idea that expert scientists' views on politically controversial topics can be completely objective.

Political ideology was the factor next most strongly associated with meteorologists' views about global warming. This also goes against the idea of scientists' opinions being entirely based on objective analysis of the evidence and concurs with previous studies that have shown scientists' opinions on topics to vary along with their political orientation (Nisbet 2011; Rosenberg et al. 2010). The result suggests that members of professional scientific organizations have not been immune to influence by the political polarization on climate change that has affected politicians and the general public.

Research conducted to date with meteorologists and other atmospheric scientists has shown that they are not unanimous in their views of climate change. In a survey of Earth scientists, Doran and Zimmerman (2009) found that, while a majority of meteorologists surveyed are convinced humans have contributed to global warming (GW; 64%), this was a substantially smaller majority than that found among all Earth scientists (82%). Another survey, by Farnsworth and Lichter (2009), found that 83% of meteorologists surveyed were convinced human-induced climate change is occurring, again a smaller majority than among experts in related areas, such as ocean sciences (91%) and geophysics (88%).
 

igrowone

Well-known member
Veteran
new arctic record(imo)

new arctic record(imo)

here's the current situation up at the arctic
it appears a new record low for maximum arctic surface ice has been set
that's by eye, not called by NSIDC yet, pics included below
the previous low maximum was set last year
this follows on the heels of a new low extent set for this February, that was announced by NSIDC
in short, seasonal arctic ice melt is increasing
 

Attachments

  • N_Comparison.jpg
    N_Comparison.jpg
    10 KB · Views: 21
  • N_stddev_timeseries_thumb.jpg
    N_stddev_timeseries_thumb.jpg
    10.4 KB · Views: 20

Weird

3rd-Eye Jedi
Veteran
http://phys.org/news/2016-03-human-climate-dates-1930s.html

Human influence on the climate dates back to 1930s

Humans have triggered the last 16 record-breaking hot years experienced on Earth (up to 2014), with the new research tracing our impact on the global climate as far back as 1937.

The findings, led by Dr Andrew King from the University of Melbourne and the ARC Centre of Excellence for Climate System Science, suggest that without human-induced climate change, recent hot summers and years would not have occurred.

It's also a conclusion that has been masked until recent decades in many areas by the wide use of industrial aerosols, which have a cooling effect on temperatures - another key finding of the paper.

"Everywhere we look the climate change signal for extreme heat events is becoming stronger," Dr King said.

"Recent record-breaking hot years globally were so much outside natural variability that they were almost impossible without global warming."

The record-breaking hot years attributable to climate change globally are: 1937, 1940, 1941, 1943-44, 1980-1981, 1987-1988, 1990, 1995, 1997-98, 2010, 2014.

"In Australia, our research shows the last six record-breaking hot years and last three record-breaking hot summers were made more likely by the human influence on the climate."

"We were able to see climate change even more clearly in Australia because of its position in the Southern Hemisphere in the middle of the ocean, far away from the cooling influence of high concentrations of industrial aerosols," Dr King said.

Aerosols in high concentrations reflect more heat into space, thereby cooling temperatures. However, when those aerosols are removed from the atmosphere, the warming returns rapidly.

This impact was seen very clearly by the researchers when they looked at five different regions, Central England, Central Europe, Central US, East Asia and Australia.

There were cooling periods, likely caused by aerosols, in Central England, Central US, Central Europe and East Asia during the 1970s before accelerated warming returned. These aerosol concentrations also delayed the emergence of a clear human-caused climate change signal in all regions studied except Australia.

"In regards to a human-induced climate change signal, Australia was the canary in the coal mine for the rest of the world," said Dr King.

For the study, Dr King and PhD student Mitchell Black examined weather events that exceeded the range of natural variability and used climate modelling to compare them to a world without human-induced greenhouse gases.
 

trichrider

Kiss My Ring
Veteran
http://www.jpl.nasa.gov/news/news.php?feature=6082


News | March 14, 2016
Dueling Climate Cycles May Increase Sea Level Swings
Higher Pacific sea levels increase coastal flooding risks.

The tropical Pacific Ocean isn't flat like a pond. Instead, it regularly has a high side and a low side. Natural cycles such as El Niño and La Niña events cause this sea level seesaw to tip back and forth, with the ocean near Asia on one end and the ocean near the Americas on the other. But over the last 30 years, the seesaw's wobbles have been more extreme, causing variations in sea levels up to three times higher than those observed in the previous 30 years. Why might this be?

A new NASA/university study has found the differing alignments of two separate climate cycles could be causing these intensifying swings, which occur on top of a global rise in sea level due to melting ice sheets and warming oceans. The findings may help improve forecasts of sea level variations, allowing vulnerable coastal communities to prepare for their increased risk of flooding, erosion and other damage due to higher sea levels.

Tony Song of NASA's Jet Propulsion Laboratory, Pasadena, California, and colleagues looked at the correlations of tropical Pacific sea level with different phases of two important climatic cycles: the Pacific Decadal Oscillation (PDO) and El Niño/Southern Oscillation.
Cycles in the Pacific Ocean
Song and his coauthors studied the interactions of two cycles, El Niño/Southern Oscillation (ENSO) and the Pacific Decadal Oscillation (PDO). Each cycle has two phases that create specific patterns of warm and cool water in the Pacific and cause changes in the trade winds, which affect sea levels. However, the cycles vary greatly in location within the Pacific and in length.

ENSO's phases are the well-known El Niño and La Niña events. They are detected as warm or cool surface waters, respectively, in the tropical Pacific, around the equator. These events arise every few years and last six to 18 months. The PDO's two phases are called positive and negative. They are also detected as warm or cool pools of surface waters, but those pools appear at least a thousand miles north of the equator -- north of 20 degrees north latitude. The PDO usually remains in a single phase for 20 or 30 years, though it may briefly flip to the opposite phase within that time.

Song and his team found that the phases of these cycles can either reinforce or dampen each other, directly affecting the variability of sea level across the Pacific.

From 1990 to 2000, the magnitude of these sea level swings averaged about 6 inches (16 centimeters) -- five times the height of global sea level rise during the same period. Asia is currently on the high side of the sea level seesaw, while coastlines in the Americas as far north as Southern California are benefiting from a lower sea level. For communities threatened by rising seas, predicting when the seesaw will swing the other way is critical.

The two phases of the PDO and the two phases of ENSO can combine in four different ways, just as when you flip a dime and a nickel together you can get four different combinations of heads and tails. Song and his colleagues made a 60-year record of when each of the four combinations prevailed in the tropical Pacific and compared that record with the observed east-west swings in sea level over the same period.

Correlations jumped out between two of the four combinations and sea levels: El Niño plus positive PDO correlated with high sea levels in the Americas, and La Niña plus negative PDO correlated with high Asian sea levels.

"These things matched so nicely that we were very surprised," said Jae-Hong Moon, lead author of a paper on the research published in the Journal of Geophysical Research -- Oceans. Moon did most of the research while working at JPL but is now an assistant professor at Jeju National University, Jeju City, South Korea.

These newfound correlations provide a plausible answer to the question of why sea level swings appear to have intensified in recent decades. For the entire period of 1950 to 1980, the Pacific was in a negative PDO phase while El Niño and La Niña events occurred. This means that only two of the four possible combinations of phases could occur. Study authors argue that when one of these two combinations -- negative PDO and El Niño -- is in place, the cycles counteract each other, dampening the effect on sea level that each would have had individually.

From 1980 to 2010, there were both negative and positive PDO phases in addition to El Niño and La Niña events. In fact, all four combinations of the two cycles could be observed at some point during this period. El Niño-positive PDO phase and La Niña-negative PDO phase alignments occurred in this time period, but were not seen in the previous 30 years. This increased the variability in sea level.

Whether this increased variability will continue is unclear, Song explained, because scientists do not yet understand exactly what triggers a change of phase in either cycle. "We are glad to have uncovered one more puzzle piece in the ongoing study of Pacific ocean variability," he said.
 

Weird

3rd-Eye Jedi
Veteran
http://www.theguardian.com/environm...ate-scientists?CMP=twt_a-science_b-gdnscience

February 2016 was likely the hottest month in thousands of years, as we approach the 2°C danger limit.


“Stunning,” “wow,” “shocker,” “bombshell,” “astronomical,” “insane,” “unprecedented”– these are some of the words climate scientists have used to describe the record-shattering global surface temperatures in February 2016.

NASA GISS global monthly (red) and 12-month average (blue) surface temperatures as compared to pre-industrial temperatures. Photograph: Dana Nuccitelli

It’s difficult to see any ‘pause’ or slowdown in the global warming over the past 50 years.

To put the current temperatures into context, prior to last October, monthly global surface temperatures had not been more than 0.96°C hotter than the 1951–1980 average, according to Nasa. The past 5 months have been 1.06°C, 1.03°C, 1.10°C, 1.14°C, and 1.35°C hotter than that average, absolutely destroying previous records. Estimates from Noaa are in broad agreement with those from Nasa.

Right now, the Earth’s average surface temperature is hotter than it’s been in thousands of years; potentially even longer. How much of a role is El Niño playing?

We’re currently at the peak of a very strong El Niño event, which has brought warm water up to the ocean surface. That’s certainly played a major role in the current record-breaking temperatures. The hottest years are almost invariably years with El Niño events, although 2014 was the first year in decades to set a temperature record without an El Niño.

For comparison, the current El Niño event is very similar to a previous one in 1997–1998. That event made 1998 by far the hottest year on record at the time, and it’s why contrarians often cherry pick temperatures over the past 18 years – the abnormally hot 1998 was 18 years ago.

However, the past 6 months have been 0.43°C hotter than the corresponding months in 1997–1998. So clearly, while El Niño is a big contributor to the current record-shattering temperatures, human-caused global warming is playing a major role as well. Climate scientist Michael Mann attributed the record to approximately 50% human influences, and 50% a combination of El Niño and natural weather fluctuations.
Are temperatures approaching dangerous levels?

Last December, 195 countries signed the COP21 international climate agreement in Paris. Graham Readfearn summarized the agreement for The Guardian:

The guts of the agreement hang off the so-called “long-term goal” that commits almost 200 countries to hold the global average temperature to “well below 2°C” above pre-industrial levels and to “pursue efforts to limit the temperature increase to 1.5°C”.

Depending on how exactly we define “pre-industrial,” February temperatures were between 1.5 and 2°C hotter than those in pre-industrial times. So, we’re already starting to tread on thin ice, in the range that the global community has deemed dangerously hot.

However, since we’re at the peak of an El Niño, as they did after 1998, global surface temperatures will temporarily go back down once this event is over. That is, until human-caused global warming pushes them up to and beyond these temperatures once again in the near future. As climate scientists Steve Sherwood and Stefan Rahmstorf wrote,

This is the true climate emergency: it is getting more difficult with each passing year for humanity to prevent temperatures from rising above 2℃. February should remind us how pressing the situation is.

A glimpse at the consequences of global warming

In the meantime, we’re getting a glimpse at the future climate consequences of our carbon pollution. Just to name a few, Africa is being battered by heat and drought, with more than 36 million people facing hunger across the southern and eastern parts of the continent as a result. Droughts in Vietnam and Zimbabwe have cost these countries 4% and 12% of their GDP, respectively. Arctic ice is in poor shape as a result of the region’s warmest-recorded winter. Australia has been breaking heat records as well, with 39 consecutive days in Sydney above 26℃ (double the previous record). And a massive coral bleaching event appears likely on the Great Barrier Reef.


Arctic heat so extreme this winter that govt. mappers ran out of colors https://t.co/Ne9igrf9VD pic.twitter.com/5DHkUmsfPK

These are some of the reasons why temperatures 1.5–2°C above pre-industrial levels are considered dangerous. This intense heat is not good for agriculture, ice, sea levels, or coral reefs. There’s still time for us to prevent such high temperatures from becoming the norm, but that time is running out.

Fortunately there’s been some good news that we may be on the verge of getting carbon pollution and global warming under control, but we have to continue with this progress and avoid reversing it. People seem to be grasping the problem just in time: a record number of Americans (41%) now see global warming as a threat, and almost two-thirds realize that humans are responsible. California is providing a blueprint for solving the problem, as the state’s carbon pollution has fallen despite a growing population, as its economy has thrived.

We’re capable of solving the climate problem, but with temperatures already approaching dangerous thresholds, the time to act is now.
 

St. Phatty

Active member
I was reading about an Indian tribe in Louisiana that's giving up their tribal land because it's being flooded - by rising ocean levels.
 

trichrider

Kiss My Ring
Veteran
Changes in Land Water Storage and Melting Ice Sheets Drive Polar Motion
8 April 2016
Nadia Ramlagan

Changes in terrestrial water storage, along with the melting of polar ice sheets, are driving changes in Earth's polar motion, researchers report. The findings, which appear in the 8 April issue of Science Advances, help explain why there has been a dramatic eastward shift in the general drift direction of Earth's spin axis since the year 2000.

"With our new insight into the relationship between land water storage and polar position we can now place new bounds on how much ice sheets and wet or dry epochs changed during the entire 20th century," said Erik Ivins, a senior research scientist at NASA's Jet Propulsion Laboratory and co-author of the study.

The Earth is spinning from west to east (making one cycle each day) and the axis about which Earth spins is called Earth's spin axis. Because the spin axis crosses Earth's surface at two points, or rotational poles, scientists call the motion of Earth's spin axis "polar motion."

In the past one hundred years or so, scientists have observed changes in polar motion related to the loss of ice sheets. As this meltwater drains into the oceans, it redistributes the Earth's mass in a way that can shift the spin axis.

Specifically, it's been well-documented that the North rotational pole has moved toward Hudson Bay, Canada, during the 20th century, and that this long-term motion is related to a mass deficit in the region following the collapse of the Laurentide Ice Sheet in North America.
Patterns of continental water storage are related to an east-west wobble in Earth's spin axis. In Eurasia, for instance, water loss corresponds to an eastward swing (top) while water gain pushes the axis westward (bottom).| NASA/ JPL-Caltech

But since about the year 2000, the North rotational pole has begun heading along the Greenwich meridian, representing a dramatic, 75-degree eastward shift in drift direction. Many scientists argue that melting of polar ice sheets in Greenland and Antarctica are alone responsible for this eastward shift, but the exact cause remains unknown, despite many theoretical and modeling efforts.

Now, Ivins, along with colleague Surendra Adhikari, a postdoctoral program fellow at NASA's Jet Propulsion Laboratory, have analyzed satellite measurements of Earth gravitational fields (which can be used to track changes in how mass is distributed on the planet) from 2003 and 2015. Their results show that the recent dramatic eastward shift in polar motion is a result of both the melting of the Greenland and West Antarctic ice sheets and both losses and gains in global terrestrial water storage (the amount of water held in the continents) in different parts of the world.

The effects of terrestrial water storage on polar motion demonstrated in this study help to resolve another long-standing puzzle, serving as a possible physical mechanism for the decadal-like east-west swings in polar motion that have been documented throughout the modern 115-year long record. These swings may correspond with near-decadal changes in continental rainfall and drought, the authors say.

"During 2003 to 2015, water mass changes — in the form of ice and liquid water — controlled decadal-scale changes in the position of Earth's spin axis. [Axis] changes of this sort have been observed for more than a century, and no one has found a plausible explanation of them until now," said Adhikari.

Analyzing the 20th century polar motion record could therefore potentially reveal new information about the past climate, such as whether the intensity of drought or wetness has amplified over time and in what locations, providing possible data constraints for models of past climate change. Such model quantification will have important ramifications for climate change during the 21st century, the authors say.

http://www.aaas.org/news/changes-land-water-storage-and-melting-ice-sheets-drive-polar-motion
 

Latest posts

Latest posts

Top