What's new

Information About Grow Light Spectrum, PAR, Photosynthesis, Leaf Surface Temperature

Ibechillin

Masochist Educator
I put together a detailed thread on lighting terminology/science and photosynthesis on 12/5. I highly recommend reading to clarify the science of it all between HPS/MH, Double Ended HPS, CMH and Led.

Watching Canna Cribs and Growing Exposed episodes on youtube, I realized many licensed producers are running led fixtures. Licensed Growers can get rebates on the led fixtures up to 90% off MSRP through their power company for using less than 1000w lights, yielding the same or even more with higher terps and potency! If a facility running hundreds of lights can confidently switch completely over and boast improvement, there has to be some truth to the claims I figured.

Here is the company that specializes in grow lighting rebates for licensed producers (lighting quotes are free)
https://growrebates.com/

Those videos are why I started researching Led heavily and made the lighting information thread. Black Dog LED, Fluence and California Lightworks together have extensive research and testing published on their sites (for cannabis specifically even). I put the thread together using information from all 3 and HID light spectrum comparisons from Growers House, all very credible sources (along with additional research of my own).

From Black Dog LED Site:

"Various artificial grow light technologies create different light spectrums. LED grow lights differ significantly from other forms of artificial plant lights in that the spectrum can be tuned, eliminating unwanted excesses of light wavelengths (colors) while providing light plants can use most efficiently. Other artificial lighting technologies produce much of their light as an unintended and unavoidable byproduct of how they operate, ultimately wasting energy in heating up plant leaves.

When a photon of light hits a plant leaf, it can either be reflected or absorbed. Reflected photons will not affect the leaf temperature at all, but physics dictates that all photons absorbed by the leaf will increase the leaf temperature; how much depends on the energy (wavelength) of the photon and whether or not some of that energy was used to trigger other chemical reactions, such as photosynthesis. Photons fully utilized by the plant in chemical reactions will heat the leaf less than photons which are absorbed but not utilized. Therefore, measuring leaf surface temperature indirectly measures the efficiency of the light spectrum for growing plants-- less-efficient spectrums will tend to heat the leaf more, while more-efficient spectrums will heat the leaf less as more of the light energy is being converted to chemical energy.

High Pressure Sodium (HPS) in particular converts a significant portion of the energy consumed by the light directly to non-visible infrared light in the 810-830nm range, peaking about 819nm. This infrared light is perceptible to you (and plants) by the warmth it creates when exposed to the light. Additionally, much of the visible light HPS bulbs produce is yellow and not highly-utilized by plants. This radiation not used for photosynthesis or other chemical reactions only serves to heat up the leaves, requiring cooler ambient temperatures to keep the plants' leaves at their ideal temperature."

Link To Leaf Surface Temperature Full Study (Other Plant Results Than Cannabis Also):
https://www.blackdogled.com/lst

HPS Lamps have an interior wall temperature around 752 degrees Fahrenheit (400 Celsius), CMH Ceramic arc tubes can operate at higher temperatures over 1700 degrees Fahrenheit (927.67 Celsius) so they can be potential fire hazards. Many city and county safety codes are beginning to prohibit the use of HID systems in residential indoor grows due to the dramatic increase in “closet fires”. Roughly 75% of all the energy consumed by an HID lamp is emitted as heat, and most of that heat is in the form of Infra-Red (IR) radiation. So not only do HID systems require significant air-conditioning, but the high levels of IR heat the leaves without raising the air temperature, and this differential can cause localized heat stress, fox-tailing, and other heat related problems even when the room air temperature is in a safe range, Optimal leaf surface temperature is around 88f for cannabis, which under hps occurs around 75f ambient room temperature.

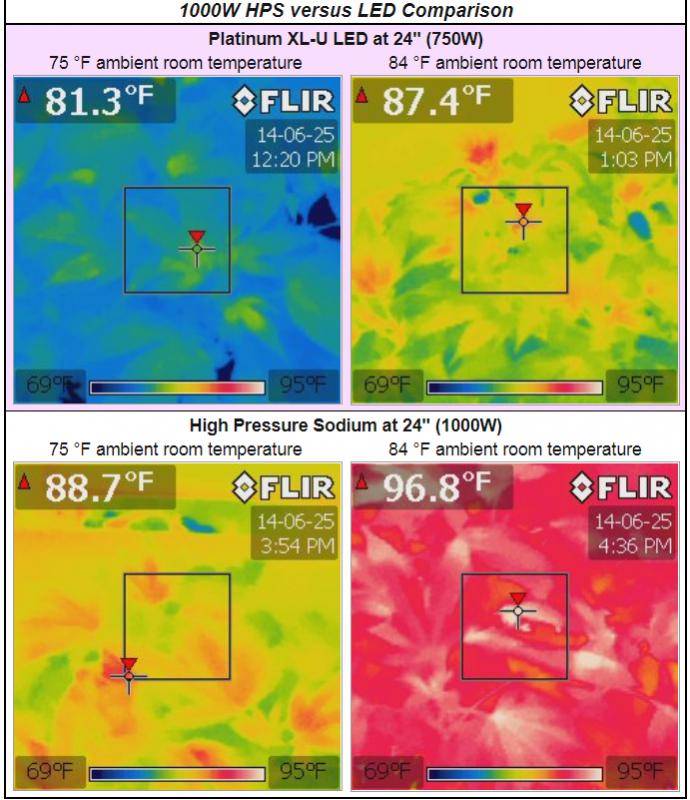
Here is a comparison of leaf surface temps between 1000w HPS and 750w led both at 24" above canopy at 75f and 84F ambient room temperatures. All images below were taken with the FLIR camera's color scale locked between 69 °F and 95 °F to allow for easier direct comparisons. In this color scale, blue and cyan correspond to temperatures in the 70-79 °F range, green, yellow and orange represent the 80-89 °F range, and red-orange, red and white indicate temperatures in the 90+ °F range.
picture.php


Led doesnt emit all of the unnecessary extra light spectrum that plants cant utilize. The leaf surface temp is much lower at 75f ambient room temperature because more of the light is available for growth. Being able to run the grow room at a warmer 84f temp can also save on AC if you live in a warm area.

Reproducing This Experiment Yourself:

Leaf surface temperature in otherwise-identical conditions can be greatly influenced by the thickness of leaves and their pigmentation level, which depend on the conditions an individual plant has been exposed to up to that point. Using the same exact plants for all conditions in the experiment eliminates the possibility of this natural variation affecting the results. (This would also suggest using near consistent lighting from seedling/clone to harvest for strongest establishment.)

Keep in mind that relative humidity affects how much evaporative cooling can cool the leaf, and that relative humidity is relative to the temperature. If you have 50% relative humidity in a 75 °F room and just heat the air up to 84 °F, the relative humidity will drop to 37%, and evaporative cooling will have a greater effect on leaf surface temperature.

As you can see from our FLIR pictures, leaf surface temperature can vary significantly even within one leaf. Using an infrared thermometer to measure leaf surface temperature will only give the temperature at a single point. A FLIR camera gives you a better picture (literally) of the full temperature range over the leaves.

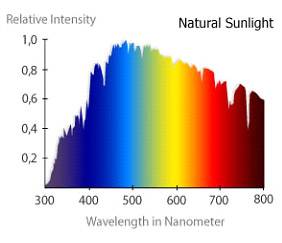
Natural Sunlight Spectrum:
picture.php


Plants evolved over millions of years to best convert light energy into carbohydrates and sugars. The most readily available light from the sun is in the middle part of the spectrum which we see as green, yellow and orange. These are the primary frequencies that human eyes use. However, studies show that these are the least used light frequencies in plants. Most of the photosynthetic activity is in the blue and red frequencies. The main reason for this counter-intuitive use of light by plants seems to be related to early forms of bacteria and the evolution of photosynthesis. Photosynthesis first evolved in bacteria over millions of years in the primordial sea. This evolved in bacteria long before the appearance of more complex leafy plants. These early photosynthetic bacteria extensively used the yellow, green and orange middle spectrums for photosynthesis which tended to filter out these light spectrums for plants evolving at lower levels in the ocean. As more complex plants evolved they were left only with the spectrums not used by bacteria, mostly in the red and blue frequencies.

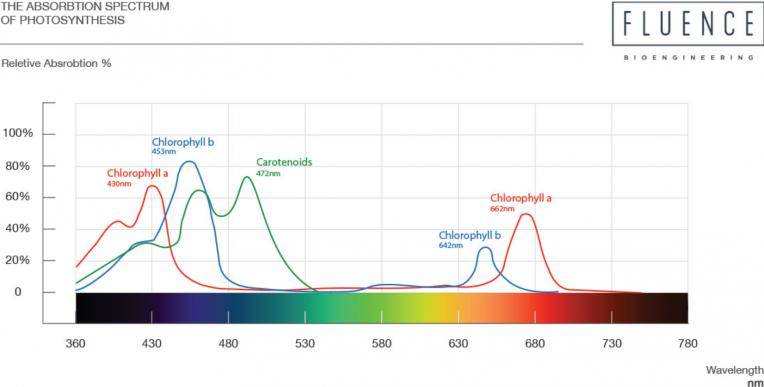
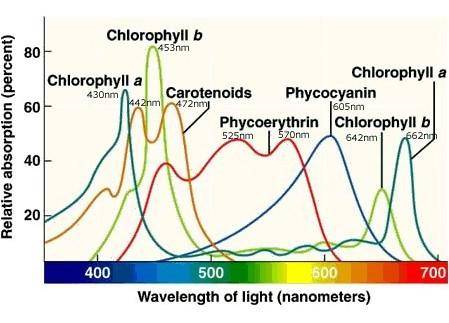
There are two forms of Chlorophyll, each has absorption peaks in both the red and blue spectrums and both reflect yellow and green giving plants their green color. Chlorophyll A is the primary photosynthetic pigment and most abundant, it has absorption peaks at 430nm blue and 662nm red. Chlorophyll B is an accessory pigment and has absorption peaks at 453nm blue and 642nm red.

Many manufacturers reference the absorption spectrum of chlorophyll A and B (shown next) which peak in the blue and red regions of the visible spectrum as the main reason for providing a purple spectrum.
picture.php


picture.php


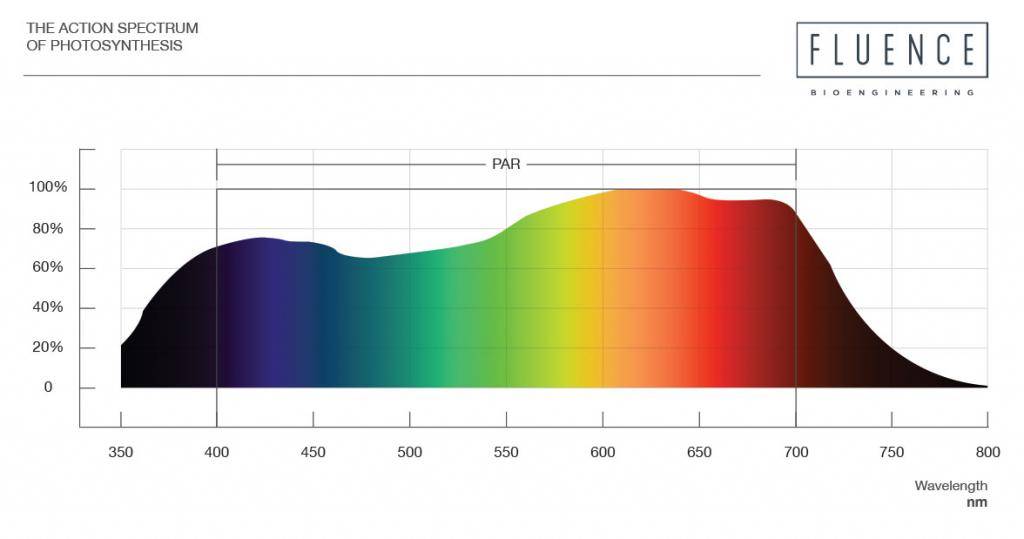
^The action spectrum of photosynthesis was created from research that was performed in the 1970s by Drs. McCree and Inada and this work was fundamental in defining the range of photosynthetically active radiation (PAR). Prior to this research, very little work had been performed to determine how varying wavelengths of light influenced photosynthesis and plant growth. These researchers utilized filters to create monochromatic wavebands to determine the influence of light spectra on photosynthesis of single leaves using an assimilation chamber.

So why is there such a difference between the absorption spectrum and the action spectrum if chlorophyll is responsible for photosynthesis?

Recent work has shown that green light does promote photosynthesis in chlorophylls, quite efficiently in fact. Green light is able to penetrate deeper into leaf surfaces to drive photosynthesis in chloroplast located towards the bottom surface of the leaf, even more efficiently than red light at high PPFD. As PPFD increases, light energy that is absorbed in the upper chloroplasts tends to be dissipated as heat, while penetrating green light increases photosynthesis by exciting chloroplasts located deep in the mesophyll (Terashima et. al., 2009). Additionally, green light penetrates through leaf surfaces much better than red or blue light to reach the lower canopy, which is extremely important in dense canopy production techniques which are common in controlled environment agriculture.

Chlorophylls Are Not The Only Photoreceptors That Are Responsible For Photosynthesis!
picture.php


There are other types of antenna photoreceptors which also utilize this spectrum range to promote photosynthesis, mainly the carotenoids. The carotenoid family consists of smaller families of pigments called carotenes and xanthophylls, The difference between the two groups is chemical: carotenes are hydrocarbons and do not contain oxygen, while xanthophylls contain oxygen. The two absorb different wavelengths of light during a plant’s photosynthesis process, carotenes are orange and xanthophylls are more yellow.

Carotenes contribute to photosynthesis by transmitting the light energy they absorb to chlorophyll. Carotene protects plant cells against the destructive effects of ultraviolet light and also has an important antioxidant function of deactivating free radicals — single oxygen atoms that can damage cells by reacting with other molecules. They also help to absorb the energy from singlet oxygen, an excited form of the oxygen molecule O2 which is formed during photosynthesis.

Xanthophylls are both accessory pigments and structural elements of light-harvesting complexes (Lhcs). Together with β-carotene, they act both as chromophores, absorbing light energy that is used in photosynthetic electron transport, and as photoprotectants of the photosynthetic apparatus from excess light and from the reactive oxygen species (ROS) that are generated during oxygenic photosynthesis.

So while the green/orange/yellow bands can be absorbed by other pigments like the Carotenoids, they are far less efficient. Over 50% of this spectrum range is reflected away and/or poorly utilized. Carotenoids are typically located deeper in the leaf because they get most of their photons from light that is reflected off the leaves and bounces deeper into the canopy to be absorbed through the bottom of the leaves.

Bulb Life Expectancy In different Lighting Systems:

Veg light running 16 hours per day = 5840 hours per year.

Bloom light running 12 hours per day = 4360 hours per year.

As time on goes on the spectrum of the bulbs becomes less optimal and they produce less total light. HPS bulbs are typically recommended to be replaced after ~9-12 months of 12 on 12 off flowering light cycle use (3285-4360 hrs). MH bulbs are typically recommended replaced after ~9 months of use In 16 on 8 off Vegetative Growth light cycle (4380 hrs).

CMH with stronger arc tubes and a square wave ballast are advertised to resist thermal breakdown better and last longer before needing replacement. Many Led lights are advertised to last ~50,000 hrs of use before light output degrades a similar amount to HPS or MH after the recommended replacement time.
 
Last edited:

Ibechillin

Masochist Educator
Here is The Black Dog Led Spectrum from Leaf Temperature comparison:

picture.php


Hortilux Super HPS 1000w Spectrum:

picture.php


Double Ended HPS Spectrum Comparison:

picture.php


3100k Ceramic Metal Halide Spectrum Comparison:

picture.php


Samsung 2700k led Spectrum:

picture.php
 
Last edited:

Ibechillin

Masochist Educator
Samsung 3000k led Spectrum:

picture.php


Lighting Terminology:

Electromagnetic Spectrum

The electromagnetic spectrum is the range of frequencies (the spectrum) of electromagnetic radiation and their respective wavelengths and photon energies. The electromagnetic spectrum covers electromagnetic waves with frequencies ranging from below one hertz to above 1025 hertz, corresponding to wavelengths from thousands of kilometers down to a fraction of the size of an atomic nucleus. This frequency range is divided into separate bands, and the electromagnetic waves within each frequency band are called by different names. The electromagnetic waves in each of these bands have different characteristics, such as how they are produced, how they interact with matter, and their practical applications.

classified by radio, microwaves, terahertz waves, infrared, visible light, ultraviolet, X-rays, and gamma rays

picture.php


Electromagnetic Radiation:

classified by radio, microwave, infrared, visible, ultraviolet, X-rays and gamma rays.

Full Spectrum Light:

Spectral range from Near Ultra violet 300nm to the end of the infrared spectrum 1000nm.

Ultraviolet Spectrum:

Spectral range from 10nm to 400nm.

Ultraviolet A (UVA) 315nm to 400nm

Ultraviolet B (UVB) 280nm to 315nm

Ultraviolet C (UVC) 100nm to 280nm

Near Ultraviolet Spectrum:

Spectral range from 300nm to 400nm

Visible Spectrum

The portion of the electromagnetic spectrum that is visible to the human eye. A typical human eye will respond to wavelengths from about 390nm to 700nm.

Infrared Spectrum:

Spectral range from 700nm to 1000nm (1mm)

Black Body:

A Black Body is reference to an opaque (unable to be seen through) and non reflective object which absorbs all incident electromagnetic radiation, regardless of frequency or angle of incidence.

Black Body Radiation:

Every object radiates (and absorbs) electromagnetic waves. The spectrum of this radiation is not dependent on the chemical composition of the matter but it's only determined by its absolute temperature T. It turns out that all objects behaves like blackbodies, regardless if they are actually black or not. At ambient temperature the majority of the emitted spectrum is in the long wave infrared which is not visible. As the temperature rises, the spectrum shifts towards shorter wavelengths, this is known as "Wien's shift". At temperatures around 900 K, part of the radiation becomes visible since wavelengths in the 700 nm region are present and the object start to appear "red hot".If you think of a blacksmith working a piece of hot iron, the iron glows red because its temperature is around 1'000 K, but the charcoal in the furnace glows the same color because it's at about the same temperature, even if carbon and iron are chemically very different.

The picture below shows a nail glowing red hot when heated with a propane torch: one can clearly see the hottest part of the nail glowing yellow, the part that is just outside the flame glowing red and the rest being black because normal cameras cannot see infrared radiation. The nice blue color of the flame is not due to blackbody radiation: the temperature of a propane torch is around 3'000 K so the flame should glow yellow, but the chemical reaction taking place emits a much stronger blue radiation masking the faint yellow glow.

picture.php


CCT (Correlated Color Temperature):

CCT refers to the color of the light itself. CCT does not refer to the actual temperature of the light source; instead, it describes if you were to heat a black body to 2700 degrees Kelvin, and then compare it with a light source with a CCT of 2700K, you would notice both objects glow with the same color.

CRI (Color Rendering Index):

CRI refers to how a light source renders the colors of other objects and surfaces. The CRI can reach a maximum value of 100, which means the light source in question has the same color-rendering capability as natural daylight. Color rendering is increasingly distorted as the CRI becomes lower, and there is no lower limit: negative CRI values indicate extremely poor light sources that completely distort color perception.

Lumens:

The lumen is a unit of measure of the quantity of visible light emitted by a source, Lumens are weighted according to a model of the human eye’s sensitivity to various wavelengths. This weighting means that light in the green-yellow spectrum will register significantly higher in lumens than red or blue light – the most important colors for photosynthesis in plants. While lumens may reflect how much light humans perceive, they do not adequately account for how much light your plants are actually receiving.

Luminous Flux:

Luminous flux refers to how much light energy is emitted per unit of time in all directions, and is measured in lumens. To properly measure luminous flux, you would need to place your light in a device called an integrating sphere, which is able to measure all of the light that the source produces. Luckily, this value will be provided on the data sheet for your COB, so you can save the $10,000 you were going to buy the sphere with for something else. You can use luminous flux ratings to compare COBs against one another, so long as you have the voltage and current at which the reading was taken. If you compare 2 COBs and both are rated for 10,000 lumens, but one does it at 36 volts and 1 amp (36 watts), and the other does it at 36 volts and 1.5 amps (54 watts), the first one is more efficient and is a better choice.

Lux:

Lux is a measurement of how many lumens fall on a 1 square meter surface, when lit by a source 1 meter away. 1 Lux is 1 lumen per square meter. Lux meters can be purchased pretty cheap online, but again – these are measuring lumens, and aren’t very useful for grow lighting.

Foot Candles:

A foot candle is a measurement of how many lumens fall on a 1 square foot area, 1 foot away from the light source.

PAR (Photosynthetically Active Radiation):

PAR is not a measurement of light, but a range of a light that factors in all wavelengths from 400nm (blue) to 700nm (red). The PAR range corresponds with the range of light that’s visible to humans, PAR does not intentionally weight various wavelengths of light differently like lumens do.

PPF (Photosynthetic Photon Flux):

PPF is a measurement of the total number of photons a light source emits per second that are within the PAR range. PPF is measured in micromoles per second (µMol/S). 1 Micromole is equal to 602 quadrillion photons (602,000,000,000,000,000).

PPE (Photosynthetic Photon Efficacy/Micromole per Joule):

Photosynthetic Photon Efficacy refers to how efficient a horticulture lighting system is at converting electrical energy into photons in the PAR 400nm to 700nm wavelengths measured as umol/j.

PPE = PPF ÷ actual wattage, the higher the better.

Example:

an LED light draws 300 watts and advertises 540 PPF

540 ÷ 300 = 1.8 umol/j

PPFD (Photosynthetic Photon Flux Density):

This is the measurement given from PAR meters. PPFD measures the average amount of photons in the PAR range hitting a certain area per second, PPFD is measured in micromoles per meter squared per second μmol/m2/s. Full sun on a clear day at noon is ~2000 PPFD.

Many commercial grow lights provide PPFD values, but omit critical information like the distance at which the PPFD reading was taken. Taking a single measurement of PPFD is also not worth much either – it’s better to have multiple measurements of PPFD in several different places below the light.

To Find PPFD Example:

a light advertises 500 PPF or μmol/s at 24" height.

First find out how many square meters your space is.
a 3x3 space = 0.836127 square meters.

Then take your PPF or μmol/s and divide by your square meters.

500 PPF or μmol/s divided by 0.836127 = ~598 average PPFD in a 3x3 area.

DLI (Daily Light Integral):

DLI is a cumulative measurement of the total number of PAR 400nm-700nm photons that reach the plants in a day and is represented in mol/m2/d. Plant growth is determined by the DLI. A clear summer day is 50-60 mol/m2/d, highest yields from many crops seems to be around 43 mol/m2/d according to NASA experiments.

How to Determine DLI With Grow Lighting:

A light produces 1000 PPFD which is measured per second, there are 3600 seconds per hour.

1000 PPFD x 3600 seconds = 3600000 PPFD per hour.

Divide PPFD per hour by 1,000,000 to convert umols to mols.

3600000 ÷ 1000000 = 3.6 mols per hour.

multiply the mols per hour by number of hours the lights stay on each day

3.6 x 12 hours per day = DLI of 43.2 mols/m2/d which is ideal for maximum yields according to NASA experiments.

Here is a chart of average daily DLI in San Francisco Bay in March, April, May, June, July and August:

picture.php


Here are daily DLI yield results from NASA biomass production chamber:

picture.php
 
Last edited:

Ibechillin

Masochist Educator
Hortilux Daylight Blue MH:

picture.php


Hortilux Dual Arc Spectrum:

picture.php


Dimming HPS and MH example effect on spectrum:

picture.php


CMH PAR meter measurements comparison from Growershouse at 24" height:
(averaged over area, final 5x5 is sum not averaged)

(The first bar surpassing every other CMH is the Philips Mastercolor CDM Elite 315W CMH Agro Lamp T12 - 3100K)

picture.php


Issack did a hps vs cmh comparison thread using 4 Hotilux Super HPS 1000w and 4 630w dual lamp hoods with Philips Mastercolor CDM Elite 315W CMH Agro Lamp T12 - 3100K bulbs shown above as the best. Coco drain to waste fed multiple times per day with mills nutrients, 1000ppm co2 and ideal temperature, HPS side averaged about 1 gram per watt, Philips side had one lamp hit 2 grams per watt and the other 3 cmh around 1.4+ gram per watt.

Link To Thread

https://www.icmag.com/ic/showthread.php?t=352859

Increasing Potency With UV:
(From California Light Works and Black Dog LED)

Pictured Is 100nm to 1000nm

picture.php


The Ultraviolet (UV) spectrum ranges from about 100 nanometers (nm) and 400 nm.

UVA, from about 315 nm to 400 nm, is an extension of the deep blue light spectrum and is included in most artificial light sources. Some level of photosynthesis occurs in this range.

UVB, from about 280 to 315, is somewhat damaging to plants in high levels and causes sunburns on humans. UVB causes damage in plants in much the same way as it damages human skin, and plants created defenses against UVB in the form of a protein called UVR8.

UVC, from about 100 nm to 280 nm is highly damaging to all living things. This is often used in sterilization and killing bacteria.

Photoreceptors like phytochromes mediate many aspects of vegetative and reproductive development and are responsible for absorbing UV, blue, red and far-red light. Cryptochromes, phototropins, and Zeitlupe (ZTL) are the three primary photoreceptors that mediate the effects of UV-A.

UV-B light is primarily mediated by the UV-R8 monomer. UVR8 is a protein molecule which senses UV, and then “tells” plant cells to change their behavior. Exactly how UVR8 molecules sense UV was recently discovered and is pretty interesting. UVR8 is what chemists call a “dimer,” which simply means that it’s made of two structurally similar protein subunits. When UV light hits the two protein subunits in UVR8, their charge weakens and they break apart. After the protein subunits break apart, they head to the cell nucleus to deliver their information. One of these changes caused by this reaction is very important in your cannabis garden. UV stress stimulates cannabis’ production of chemicals via the phenylpropanoid pathway, specifically malonyl-CoA and phenylalanine. Cannabis uses malonyl-CoA to make Olivtol, which it in turn uses to make THC. So finally the specific pathway which increases Cannabis potency when exposed to UV light is understood, and we can use this information to our advantage.

Safety Around UV in the Grow Room:

There is a threshold where the damage caused by high level UVB will exceed any benefits in potency, so caution and careful design protocols MUST be used when attempting to supplement UVB. It is also VERY important to be EXTREMELY careful using off-the-shelf UVB sources like lizard lights that are not specifically designed for human exposure, because while sunlight has quite high levels of UVB, the intensity of the sun prevents people from staring straight at it. UVB is invisible, so your eyes can’t tell you if they are getting too much UVB from a UVB light source in your grow room, and your eyes and skin can be damaged if the levels are too high.

Black Dog LED Says:

From our own research grows, Black Dog LED has demonstrated that UVA light alone can increase THC and CBD production in Cannabis plants. The UVA increases production of secondary metabolites such as THC, CBD, terpenes and flavonoids but without the negative effects of UVB light.
The combination of UVA and UVB light (from a standard "reptile bulb" fluorescent light) also increases THC and CBD production, but the inclusion of UVB in the light has noticeable detrimental effects on plant growth compared to only UVA.

From our experimentation, having about 3.5-4% UVA (as much as natural sunlight at noon) and 96-96.5% PAR light is about the right ratio for maximizing quality and canopy penetration without overly stressing the plants from too much UV. This is why we've engineered the Black Dog LED Phyto-Genesis Spectrum™ to only include UVA light, without any UVB wavelengths.

Link To Sources On UV:

https://californialightworks.com/uvb-light-and-thc-potency/

https://www.blackdogled.com/blogwhich-is-better-uva-or-uvb/

https://alliedscientificpro.com/web/content/product.attachment/1256/product_attachment/UV%20in%20Plant%20Photobiology%20-%20White%20Paper

https://medicalmarijuanagrowing.blogspot.com/2013/02/uvb-uva-lighting-study-results.html

https://medicalmarijuanagrowing.blogspot.com/2013/06/updated-uva-uvb-medical-marijuana-study.html

https://medicalmarijuanagrowing.blogspot.com/2013/12/how-to-achieve-uniform-thc-and-cbd.html

https://medicalmarijuanagrowing.blogspot.com/2014/09/myth-or-magic-next-uva-uvb-cannabis.html

https://onlinelibrary.wiley.com/doi/pdf/10.1111/j.1751-1097.1987.tb04757.x

https://www.rollitup.org/t/reptile-lights-led-with-uv.908551/page-3
 
Last edited:

Ibechillin

Masochist Educator
Skoomd did alot of research and growing with multiple budget led lights before going DIY. He recommends the Roleadro brand on amazon as the best budget $70-$100 led fixtures and pulled 1.25+ grams per watt with 3 plants vegged for 8 weeks in a 2x4x5 grow tent. Comes with 30 day money back guarantee and 2 year warranty. The fans in these budget systems are known for failing early, Roleadro's customer service seems responsive from my looking into them. (probably good to have a backup light just in case you have to send it in for repair at some point.)

Here Is A Good Review/Overview Of Roleadro With Information On The Parts They Are Constructed With:

https://www.epicgardening.com/roleadro-galaxyhydro-review/

Here is the post from skoomd on budget led fixtures and their light spectrums and grow/yield results.

https://www.reddit.com/r/microgrowery/comments/6z12zu/viparspectra_leds_are_a_huge_scam_heres_why_long/?st=jpdxoxyn&sh=a3e6469e

Viparspectra lights spectrum example:
(Completely missing the Chlorophyll A peak at 430nm and moderately stimulating 662nm)


Vipar-Spectra-Spectrum..jpg


Here is the MarsHydro 600 Spectrum:
(narrowly missing the Chlorophyll A peak at 430nm and moderately providing 662nm)


picture.php

It was no where near as easy to pull a gram per watt under the marshydro as it was with the galaxyhydro/Roleadro, which always gave me at least 1g/w.

Here is the Roleadro 1000w (140w actual) that skoomd used and recommends, covers 2x2 area $98.99:
advertised is 845 ppfd 12" above canopy, 453 PPFD at 18" height.


https://www.amazon.com/Roleadro-Galaxyhydro-Indoor-Spectrum-Flower-1000w/dp/B00PH1MQV8

Here is the spectrum for the Roleadro^:
(Includes UVA, Lots of intensity at the 662nm Chlorophyl A peak and ideal red to blue ratio for flowering.)


69251dd0-8451-46ef-93a7-b2459085f1fe._SL300__.jpg


For anyone curious, here's the 1.25 gram per watt run with the marshydro 600w and galaxyhydro 300w. Mind you, I paid 150$ shipped for both of those lights (sale on ebay). If I went with viparspectra, it would have costed over 250$ for the same watts.

And yes, that last pic is 2 foot+ long colas. Whoever said leds have poor light penetration knows nothing about lighting physics (more light sources + raised light height + reflective walls + wide beam spread = amazing light penetration)

picture.php


The data Ive gathered from Black Dog Led grow yields suggests under the spectrum they use 350PPFD to 400PPFD average over a given area is good for 1 gram per watt, increasing to ~1.25 grams per watt ~500PPFD. At 930PPFD 1.56 grams per watt was achieved. I feel like this was more light than the plants could utilize without co2 supplementation or air exchange twice per minute at the least and could have yielded more considering it was twice the amount of light intensity needed for 1.25 grams per watt.

In my opinion DIY 2700k spectrum Samsung F series gen 3 single row 24v led strip builds on aluminum frame are really efficient, and can be built for around $1 per actual watt of draw from the wall/outlet. The F series' LM561C gen 3 diodes are the 2nd most efficient diode offered by Samsung in luminous efficacy behind the LM301b used in the V2 quantum boards.

F series have the most diodes per led strip Samsung offers and multiple overlapping sources of light reduces loss over a given distance. F series gen 3 can provide very even coverage and great canopy penetration. With his ~320w 10 strip build on a 24" x 32" frame in a 3x3 tent skoomd claimed 727PPFD even coverage at a height of 1 foot, 695PPFD even coverage at a height of 1.5 feet above the canopy, and finally 550PPFD even coverage at a height of 3 feet above the canopy.
That is unbelieveable. Shout out to the naysayers saying LEDs can't penetrate deeeeeeeeep down.

Skoomd and midwest toker are claiming ~1.9gpw currently with very similar builds.


my last grow where I pulled 18 ounces out of nearly the same sized space
Yeah the diodes are running exactly at 320w Do pretty much 2 grams a watt Just 1 in a 3x3 scrog.
How about 1.9 gpw with 270 watts of LEDs or 18 ounces from a 3x4 under said wattage of LEDs.
 
Last edited:

Emperortaima

Namekian resident/farmer
Damn man I'm extremely impressed with these threads you're compiling together going to have to read the others later but much appreciated for these contributions SERIOUSLY :D
 

Ibechillin

Masochist Educator
Edits/revisions have been made made to original posts, Added more terminology to post #5 as well as Information on increasing potency with UVA and UVB to post #7, Enjoy!

:plant grow::plant grow::plant grow::plant grow::plant grow:
 
Last edited:

Ibechillin

Masochist Educator
Information on LED from the National Lighting Product Information Program:

What Is An LED?

LEDs are semiconductor diodes, electronic devices that permit current to flow in only one direction. The diode is formed by bringing two slightly different materials together to form a PN junction (Pictured below). In a PN junction, the P side contains excess positive charge ("holes," indicating the absence of electrons) while the N side contains excess negative charge (electrons).

picture.php


When a forward voltage is applied to the semiconducting element forming the PN junction (heretofore referred to as the junction), electrons move from the N area toward the P area and holes move toward the N area. Near the junction, the electrons and holes combine. As this occurs, energy is released in the form of light that is emitted by the LED.

What Determines The Color Of An LED?

The material used in the semiconducting element of an LED determines its color. The two main types of LEDs presently used for lighting systems are aluminum gallium indium phosphide (AlGaInP, sometimes rearranged as AlInGaP) alloys for red, orange and yellow LEDs; and indium gallium nitride (InGaN) alloys for green, blue and white LEDs. Slight changes in the composition of these alloys changes the color of the emitted light.

What Now Makes LEDs Suitable For Illumination Applications?

Early LEDs, such as those often used as indicator lights on electronic equipment, created very narrowband, but not quite monochromatic light ranging in color from yellow-green to red. It was not until the development of AlGaInP and InGaN LEDs with much higher light output than the early indicator lamps that useful quantities of light could be generated from LEDs. In addition, these materials allowed for LEDs with peak wavelengths at any part of the visible spectrum to be made. White light can be made by mixing light from different parts of the spectrum.

Larger devices and packages have increased the overall light output of LEDs to levels that are useful for some lighting applications. In addition to increased size of the semiconducting elements, LED construction has also changed to make them more efficient. The crystals forming early LED junctions were grown on light-absorbing substrate materials. Using transparent substrates and optimizing the shape of the semiconducting element have increased the amount of light able to leave the device, as shown in below.

picture.php


Led Lighting Systems Example:

As with other light source technologies, such as fluorescent and high intensity discharge (Rea 2000), lighting systems using LEDs (shown below) can be thought of as having a light source (typically, the individual LED sources), a ballast (for LEDs, often called a driver), and a luminaire (the surrounding materials for optical control of the emitted light and thermal control of the overall system). Unlike traditional lighting systems with few (typically, one to four) light sources, LED systems will likely contain arrays of many individual light sources in the near future.

picture.php


What Are The Electrical Characteristics Of LEDs?

Individual LEDs are low voltage devices. Single indicator LEDs require 2 to 4 volts of direct current, with current in the range from 1 to 50 milliamperes. An illumination-grade LED containing a single semiconducting element requires the same voltage, but operating currents are much higher, typically several hundred milliamperes. A device containing multiple elements connected in series will require higher voltage corresponding to the larger number of individual elements in the device. LEDs require a specific electrical polarity, Applying voltage in reverse polarity can destroy them. Manufacturers provide specifications about the maximum reverse voltages acceptable for LED devices; 5 volts is a typical maximum rating.

Why Is It Important To Control The Current Through An LED?

A typical voltage-current relationship for an illumination-grade LED is shown below. As seen in this figure, a slight change in voltage can result in very large changes in current. Since the light output of an LED is proportional to its current, this can result in unacceptable variation in light output. If the resulting current exceeds limits recommended by the manufacturer, the long-term performance of the LED can be affected, resulting in shorter useful life.

picture.php


What is an LED driver?

An LED driver performs a function similar to a ballast for discharge lamps. It controls the current flowing through the LED. Most LED drivers are designed to provide current to a specific device or array. Since LED packages and arrays are not presently standardized, it is very important that a driver is selected that is matched to the specific device or array to be illuminated.

Can LEDs Be Dimmed?

The forward current is proportional to the light output of an LED over a large operating range, so dimming can be achieved with reductions in the forward current.

Because LEDs can be rapidly switched on and off with no harmful effects, dimming can also be accomplished using a method called pulse width modulation. By adjusting the relative duration of the pulse and the time between pulses, the apparent intensity of the LED can be dimmed. This must be done with high enough frequency (hundreds of thousands of modulations per second) that the LED appears to be continuously lighted, or else the rapid flickering will be distracting. This technique can be easily implemented electronically using direct digital control.

Does Dimming LEDs Cause Color Shifts?

Changes in the current through an LED affect the junction temperature of the device, which can shift the spectral power distributions. Red and yellow AlGaInP LEDs have larger spectral shifts than blue, green and white InGaN LEDs (Stringfellow and Craford 1997), but none of these sources undergo a degree of color shift comparable to the color shift experienced when dimming an incandescent lamp.

Does Dimming LEDs Decrease Their Lamp Life?

It has been observed that when some fluorescent lighting systems are frequently dimmed, they might exhibit reduced reliability and lamp life. This is not the case for LEDs. Life and light output degradation are determined largely by the junction temperature, with higher temperatures resulting in reduced life characteristics. Since dimming, either by reducing current or by pulse width modulation, results in lower overall junction temperatures, it will have no negative impact on LED life; it might even extend life.

How Are LEDs Affected By Heat?

In general, the cooler the environment, the higher an LED's light output will be. Higher temperatures generally reduce light output. In warmer environments and at higher currents, the temperature of the semiconducting element increases. The light output of an LED for a constant current varies as a function of its junction temperature. Figure 9 shows the light output of several LEDs as a function of junction temperature. The temperature dependence is much less for InGaN LEDs (e.g., blue, green, white) than for AlGaInP LEDs (e.g., red and yellow).

picture.php


Some system manufacturers include a compensation circuit that adjusts the current through the LED to maintain constant light output for various ambient temperatures. This can result in overdriving LEDs in some systems during extended periods of high ambient temperature, potentially shortening their useful life.

Most LED manufacturers publish curves similar to those in Figure 9 for their products, and the precise relationships for various products will be different. It is important to note that many of these graphs show light output as a function of junction temperature and not ambient temperature. An LED operating in an ambient environment at normal room temperature (between 20°C and 25°C) and at manufacturer-recommended currents can have much higher junction temperatures, such as 60°C to 80°C.

Junction temperature is a function of:

1. ambient temperature
2. current through the LED
3. amount of heat sinking material in and around the LED

Generally, the lighting specifier does not need to be aware of these relationships; the maker of an LED lighting system should incorporate appropriate heat sinking and other compensatory mechanisms. The system manufacturer should then provide a range of permissible operating temperatures within which acceptable operation will be expected.

Prolonged heat can significantly shorten the useful life of many LED systems. Higher ambient temperature leads to higher junction temperatures, which can increase the degradation rate of the LED junction element, possibly causing the light output of an LED to irreversibly decrease over the long term faster. Controlling the temperature of an LED is, therefore, one of the most important aspects of optimum performance of LED systems.

Why Is Heat Sinking Important For LED?

It is common to refer to LEDs as “cool” sources in terms of temperature. This is because the spectral output of LEDs for lighting does not contain infrared radiation, unlike incandescent lamps that produce a large amount of infrared (of course, some LEDs for manufacturing purposes are designed to produce infrared energy, but these are not considered in this publication). LEDs are also often considered "cool" because they generate light through a mechanism other than thermal excitation of a substance, such as the tungsten filament in an incandescent lamp. Although LED lighting systems do not produce significant amounts of radiated heat, LEDs still generate heat within the junction, which must be dissipated by convection and conduction. Extracting heat from the device using heat sinks and by operating LEDs in lower ambient temperatures enables higher light output and longer life of the device.

The need to ensure heat sinking with LED systems is also important to consider when these systems are installed in applications. There must be sufficient means to conduct the heat away from the system, or ventilation to cool heated surfaces by convection. Locating an LED lighting system in an insulated and relatively small space will likely result in rapidly increased junction temperature and suboptimal performance.

What Types Of Heat Sinking Materials Are Used In LED Lighting Systems?

Any material that can conduct heat away from the LED can serve as a heat sink. Most metals are excellent conductors of heat and therefore many LED manufacturers suggest that mounting materials containing metal frames, fasteners and connectors be used, and that the contact area between the LED and its mounting surface be maximized. It is also important to make a good thermal contact between the LED and its mounting surface.

Recent illumination-grade LEDs contain metal fins and wings to assist in heat sinking as well as large, flat areas suitable for attachment to heat sinks. Even larger heat sinking devices, such as those used in some computer systems, consisting of metal slugs shaped to maximize their surface area, can be incorporated into LED systems containing arrays of LEDs.

Are LEDs Available In Different Beam Distributions?

Yes. Some individual devices are available with near cosine distribution, others have some optical control built into them and spread light in a particular pattern to optimize performance for some applications. Additionally, LED systems can contain optical elements that will further adjust the resulting patterns of light from LEDs for particular applications.

Are LEDs Directional Light Sources?

An LED semiconducting element can potentially emit light in many directions, and many illumination-grade LEDs have fairly broad distribution. Note that the opacity of heat sinking materials in some LED systems can limit the resulting distribution of light.

How Does Beam Angle Effect Intensity?

Almost all indicator-type LEDs are rated by their manufacturers in terms of luminous intensity in candelas, rather than light output in lumens. Luminous intensity is a function of the angle from which an LED is seen, so this value should be considered carefully when used to characterize the light output of a particular LED. Two LEDs with the same luminous flux output can have very different peak luminous intensities, if they are designed to produce different beam angles. A narrower beam angle means a higher maximum luminous intensity for the same light output. LED packages are available in a range of beam angles from very narrow (near 6°) to quite wide (more than 100°).

When using narrow-beam LEDs, it is important to note that small variations in mounting or aiming angle can have a large impact on the appearance of an array of these devices, if the array is designed to be viewed directly.

What Is LED Bin?

There are generally small differences in color among LEDs when they are first manufactured, Manufacturers work to bin LEDs to provide batches of products that will have similar initial appearance and lumen maintenance characteristics to maintain consistent appearance.

Link To Source:

https://www.lrc.rpi.edu/programs/nlpip/lightingAnswers/led/abstract.asp
 

Ibechillin

Masochist Educator
Click on the scales in between the green online light and hazard sign under the persons name if you want to add text to the rep, otherwise just click the i find this post helpful button on the bottom right of a post. (not that i need anymore lol im over 3000 rep points atm...)
 
Last edited:

Steven/nevetS

New member
Thanks bud.
Im going to start another grow, this time im gping to try leds & other supplement lighting if needed.
Just need to read,read, & re read to digest all your great info.
 

wvkindbud38

Elite Growers Club
Veteran
I used the use 400,430,600, and 1000watt hps Hortilux bulbs when I used to grow indoors. I always had great results. I've not ran indoors in some yrs and just wonder if anybody has caught up to Hortilux??? I always say the best way to test a spectrum is to just use it once and see what you think about it.
 

wvkindbud38

Elite Growers Club
Veteran
Those 430 HPS son Argo used to have a good spectrum....the 430 HPS son Argo Hortilux bulbs. I'd like to see more reviews on bulbs and all grow equipment. There's some stuff on YouTube but never enough. And the LED lighting came while I was out of growing over the last 10yrs.....lol I think those small ufo lights had just come out when I quit lol. So I'm kinda on the fence about LEDs. But if I get a 1000 or 600mh)HPS setup I may consider adding a 1000w LED or something. I did see a guy review a nice 1000w LED....the 80-$100 Amazon ones. It's very nice just kinda small.....there's alot of confusion on spectrums. We really just wanna know if whatever bulb were gonna buy is gonna grow bigger buds!!!!!
 

Ibechillin

Masochist Educator
Spectrum effect on Cannabinoid Content:

Link To Source:

The Effect of Light Spectrum on the Morphology and Cannabinoid Content of Cannabis sativa L


https://www.karger.com/Article/FullText/489030

In the horticulture and crop science industry, it has been long known that one can manipulate plant morphology and metabolism with the light spectrum. For example, blue light has been shown to decrease internode length and enhance compactness of various species, whereas far-red and green wavelengths have been shown to induce shade avoidance syndrome symptoms, including stem and leaf elongation and premature flowering.

Chandra et al. demonstrated that the highest photosynthetic efficiency was achieved under ∼1,500 PPFD and 25–30°C. Cannabis yields are thought to strongly correlate with increasing light intensity. However, light intensity did not seem to affect the cannabinoid concentration when plants were grown under different light intensities under HPS light. It was concluded that THC concentrations of flower material could be primarily linked to cannabis variety instead of cultivation method. Increasing irradiance level correlated positively with flower dry weight.

Experiment:


16 plants were placed under each light treatment in the growth boxes, 48 plants in total. Three different light sources were used in the experiment as treatments: 2 LED light spectra, AP673L and NS1 (B100, Valoya Oy; Helsinki, Finland), and 1 HPS light source (Philips Master T-PIA Greenpower 600 W; Philips, Eindhoven, The Netherlands) with magnetic ballast (ETI, Madrid, Spain).

Light fixtures were installed in grow tents (1.2 × 1.2 × 2 m) with a Mylar interior (DR120, Secret Jardin; Manage, Belgium), equipped with an air exhaust system to maintain the temperature at 26°C during the light phase and a relative humidity of 60–70% (Vents VK 125, Vents, Kiev, Ukraine).

The light irradiance level was measured to be 450 μmol/m2/s at canopy height when plants were transferred into the grow tents. Lamps were raised during the experiment as plants grew taller to maintain equal light intensities (450 μmol/m2/s in the range of 400–700 nm) throughout the experiment.

The duration of the vegetative phase was 13 days. Out of the 16 plants in each treatment, 9 plants were selected for their good condition and uniformity and kept in the grow tents for another 46 days under a short photoperiod (12 h light and 12 h darkness) for flower induction.

The floral cannabinoid concentrations (tetrahydrocannabivarin [THCV], THC, CBD, and CBG) were measured using gas chromatography (GC) according to the community method for the quantitative determination of THC content in hemp varieties (Reg. CE 796/2004) with some modifications. 40 mg of cured and dried flower powder was weighed in a vial tube, and 4 mL of internal standard/extracting solution (ethanol with 0.01% of prazepam) was added. The sample was sonicated for 15 min at 65°C, and the extract centrifuged at 12,000 rpm for 5 min; a 1-mL aliquot of the extract was then transferred from the tube to a 2-mL glass GC vial. GC analyses were performed using a SHIMADZU GC-2010 PLUS equipped with an autosampler (H-TA srl. model HT 300 series) and a flame ionization detector (FID-2010 PLUS). The GC column was a 30 m × 0.25 mm I.D. with 0.25-µm film (RESTEK, model Rxi-5ms). Data were recorded using Labsolutions LC/GC 5.51 (SHIMADZU) software. GC conditions used for the determination of cannabinoids were: H2 at 30 mL/min as carrier gas and N2 as make up gas at 40 mL/min, and air at 400 mL/min, respectively. The split flow rate was 15.8 mL/min, split ratio 25: 1, pressure 12.76 psi, and purge flow rate 3 mL/min. 1-µL injections were used; injector and detector temperatures were 280 and 300°C, respectively. The isothermal oven temperature was 240°C and the total run time was 15 min. Quantitation was achieved by determining peak area ratios of the analytes to the internal standard versus concentrations in the range of 7.8–500 μg/mL.

The growth experiment was repeated twice. The first experiment took place in April and May 2015 and the second experiment was conducted between February and April in 2016. The average temperature and relative humidity (mean ± standard deviation) in the first experiment were 23.6 ± 2.8°C and 64.5 ± 14% for treatments AP673L and NS1. 24.7 ± 4.5°C and 56.1 ± 14.8% for HPS. During the second experiment they were 22.8 ± 3.1°C and 61.9 ± 9.9% for AP673L and NS1. 23.6 ± 3.8°C and 51.4 ± 9.2% for HPS.

Plants grown under sole HPS light may suffer from unbalanced morphology expressed by excessive leaf and stem elongation. This is due to the low R:FR ratio (i.e., the ratio between red and far-red light) and low blue light emission of the HPS lamp. The low R:FR ratio increases the activity of several transcription factors that activate genes involved in auxin biosynthesis leading to faster stem elongation. Blue light regulates morphological responses such as shoot and internode elongation, shoot dry matter, and leaf area expansion. No differences in flowering time between treatments were observed during the experiments.

picture.php


Results:

HPS resulted in a significant decline of THC concentration in flowers compared to both LED treatments in both experiments, while no significant differences between the two LED types were observed.
The amount of THC (% w/w) was highest in treatment NS1 and lowest in treatment HPS in both experiments 1 and 2. In experiment 1, HPS had 38% less (9.5%) THC compared to NS1 (15.4%), in experiment 2, the equivalent number was 26%. The drop in the THC concentration under HPS led to a corresponding decrease in CBD, THCV, and especially CBG.

The average CBD concentration showed a similar pattern to the THC concentration. The CBD concentration was highest in the LED treatments and lowest in the HPS treatment in both experiments. In experiment 1, HPS had 35% less (0.1%) CBD compared to NS1 (0.2%). In experiment 2, the equivalent number was 29%.

AP673L resulted in the highest concentration of THCV. The CBG concentration was highest in the NS1 treatment in both experiments. NS1 had 207 and 107% more CBG compared to the HPS treatment in experiments 1 and 2, respectively, and 63 and 21% more than AP673L in experiments 1 and 2.

Shorter wavelengths, in the range of blue and UV light, are found to be the most effective in the accumulation of anthocyanins and flavonoids, often by increasing the expression of flavonoid pathway genes or transcription factors. In the present study, the highest CBG and THC concentrations were measured in the NS1 treatment, which had the highest portion of blue and UV-A wavelengths in the spectrum compared to the other treatments.
 
Last edited:

positivity

Member
Veteran
You know what’s funny about those studies. They don’t align with common sense observation.

Seriously, I thank the people for their time performing the studies but there is something missing from those conclusions.
 

Latest posts

Latest posts

Top